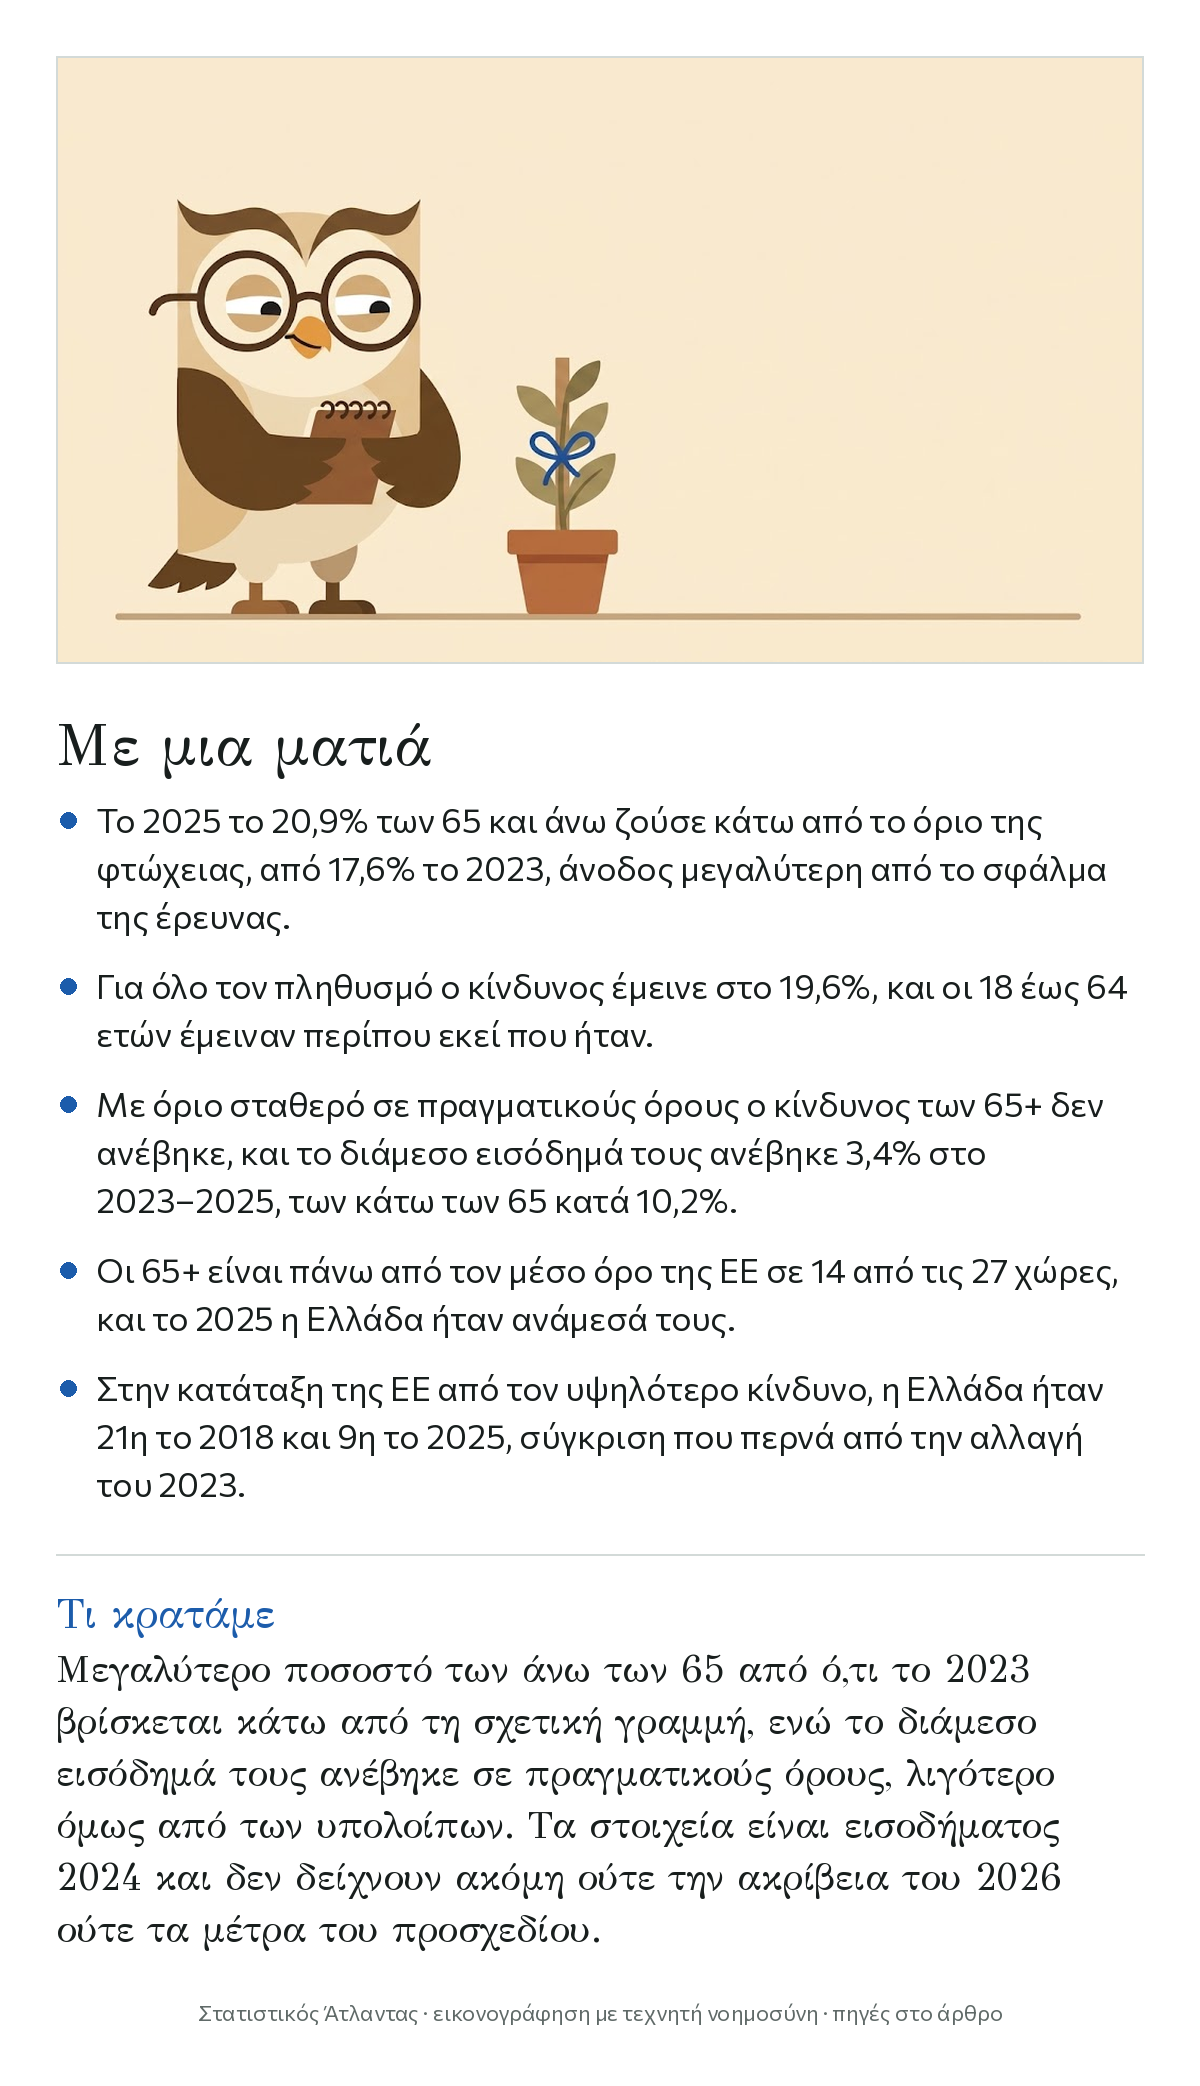
Their income rose, but the threshold rose faster. From 17.6% in 2023 to 20.9% in 2025, the poverty risk for the oldest.
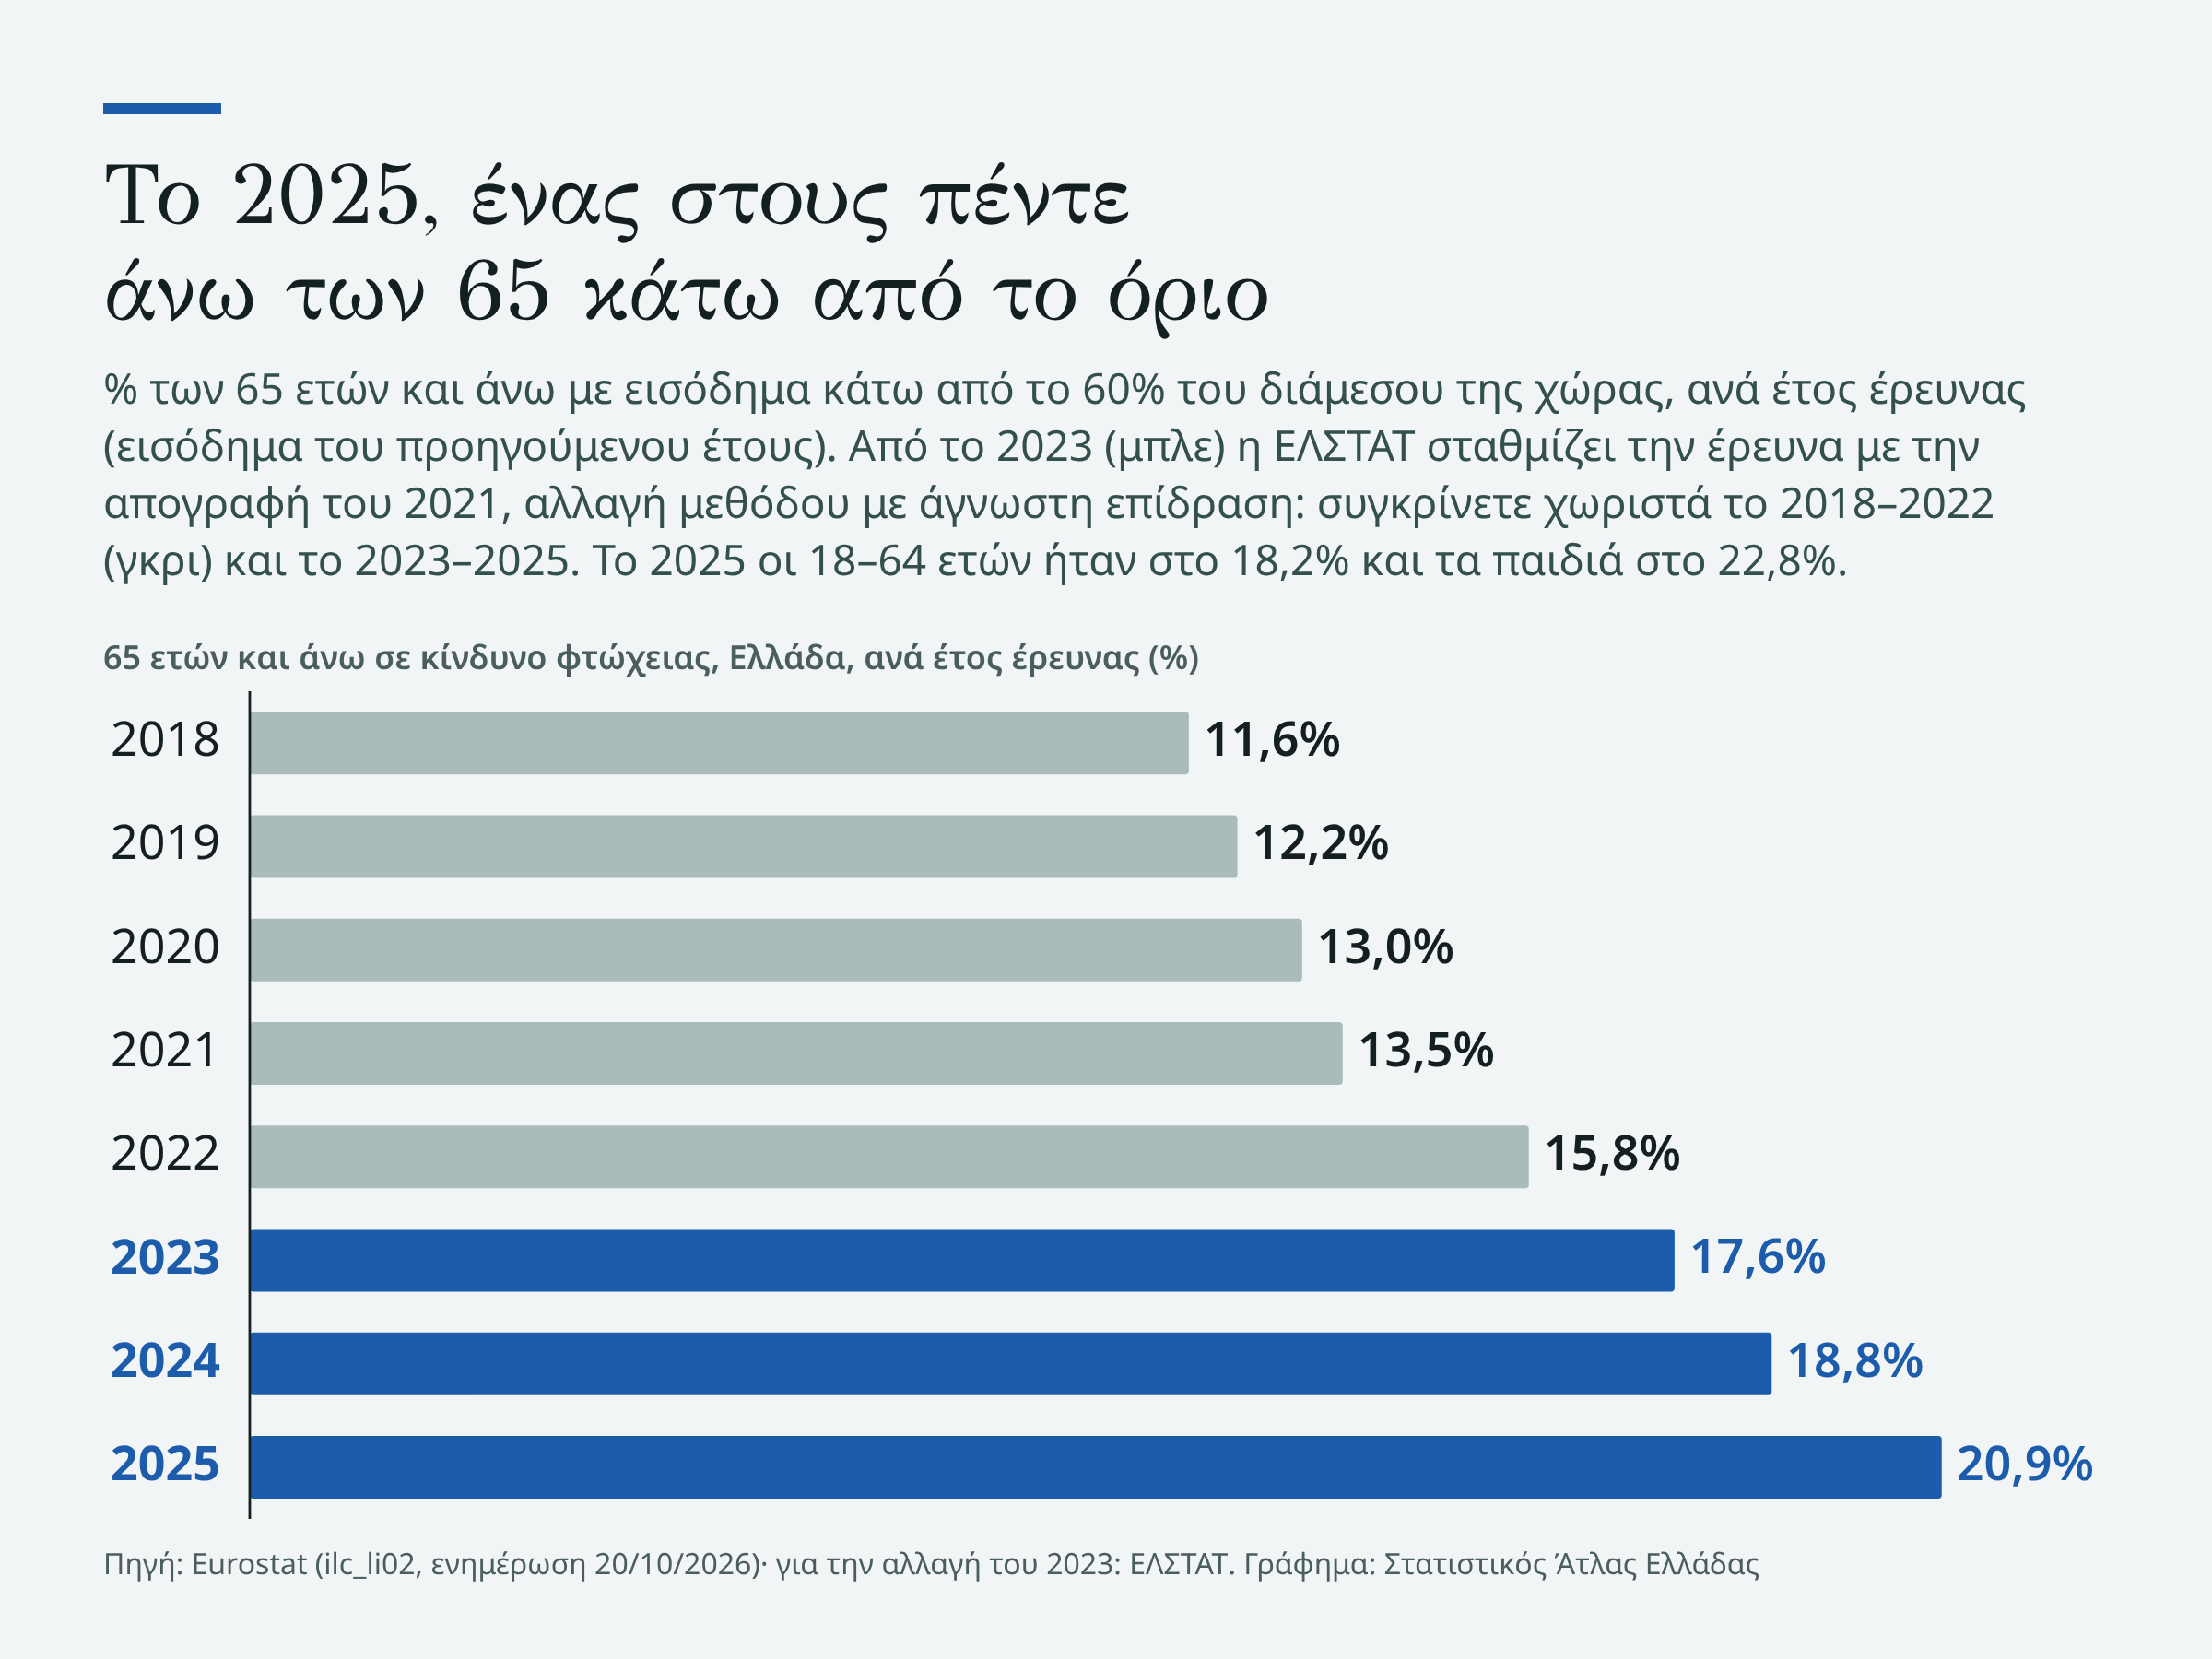
In Greece in 2025, 20.9% of people over 65 lived in a household with income below the poverty threshold, according to ELSTAT. For the whole population the poverty risk stayed at 19.6%, the same as in 2024.
For those over 65, two years earlier the share was 17.6%, and the rise is larger than the statistical error of the survey. This, however, does not show that those over 65 lost purchasing power: with a threshold fixed in real terms their risk did not rise, and their median income rose even after inflation. The poverty line is not a fixed amount: it is 60% of the country’s median income, the one that divides the population in the middle, and it rises when everyone’s incomes rise. In recent years it rose faster than the median income of those over 65.
The previous article on housing measured the housing burden; here the question is who is below the poverty line.
The rise exceeds the sampling error
The survey is sample-based, and for those over 65 the confidence interval given by ELSTAT was 16.4–18.8% in 2023 and 19.5–22.2% in 2025: the two do not overlap.
Those aged 18 to 64 stayed about where they were: 18.6% in 2023 and 18.2% in 2025, a difference within the error. Children under 18 were at 22.8%, and their difference from those over 65 is now within the error.
The rise did not begin in 2023. In 2018 those over 65 were, of the three large age groups, the one with the lowest risk, 11.6%, the lowest point of Eurostat’s EU-SILC series, which for Greece starts in 2003 with 29.4%. Professor of Public Finance Manos Matsaganis, writing for diaNEOsis in 2024, noted that until 2018 «poverty among the elderly decreased a great deal».
The comparison with 2018 needs caution, because from the 2023 survey ELSTAT weights the sample using the 2021 census and notes that this may break the series, with an unknown effect. This is why we split the path in two: from 11.6% to 15.8% in 2018–2022 and from 17.6% to 20.9% in 2023–2025.
The line rises together with everyone’s incomes
According to Eurostat, the indicator does not measure wealth or poverty, but low income compared with the other residents of the country, which does not necessarily mean a low standard of living.
The line for a person living alone was 4,718 euros a year in the 2018 survey and 7,020 euros in the 2025 survey. Removing inflation for the income years, it rose 20.4% in 2018–2022 and 8.5% in 2023–2025, by our own calculation.
An income that rises more slowly than the line can end up below it without having fallen. The data for those over 65 agree with this: in 2023–2025, removing inflation, their median income rose 3.4%, while that of those under 65 rose 10.2%.
The same is shown by the ratio of the median income of those over 65 to that of those under 65, which does not depend on the line: in 2023–2025 it fell from 0.94 to 0.88, slightly below the EU average (0.91).
With a fixed threshold, their risk did not rise
ELSTAT also measures the risk with a threshold fixed in real terms, to show the change «in absolute and not relative terms». With the 2019 threshold, adjusted only for inflation, those over 65 had a risk of 9.9% in 2025, among the lowest of all ages. Those aged 18 to 64 were at 11.4% and children at 12.9%, with differences that may be within the error, because for this indicator ELSTAT does not give errors.
With this measure the risk of those over 65 fell from 12.2% in 2019 to 9.8% in 2022, and in 2023–2025 it did not rise (10.7% in 2023, 9.9% in 2025).
The picture, however, depends on the year of the threshold: with the 2008 threshold, higher in real terms, those over 65 have, according to ELSTAT, the highest share, 33.2%, close to the 32.5% of children. And even with this threshold, their risk did not rise in 2023–2025.
Above the EU average, like 13 other countries
In 2025 those over 65 were above the EU-27 average, 16.3%, in 14 of the 27 countries, among them Greece, Germany and Portugal. In 2018 too there were 14 countries, without Greece.
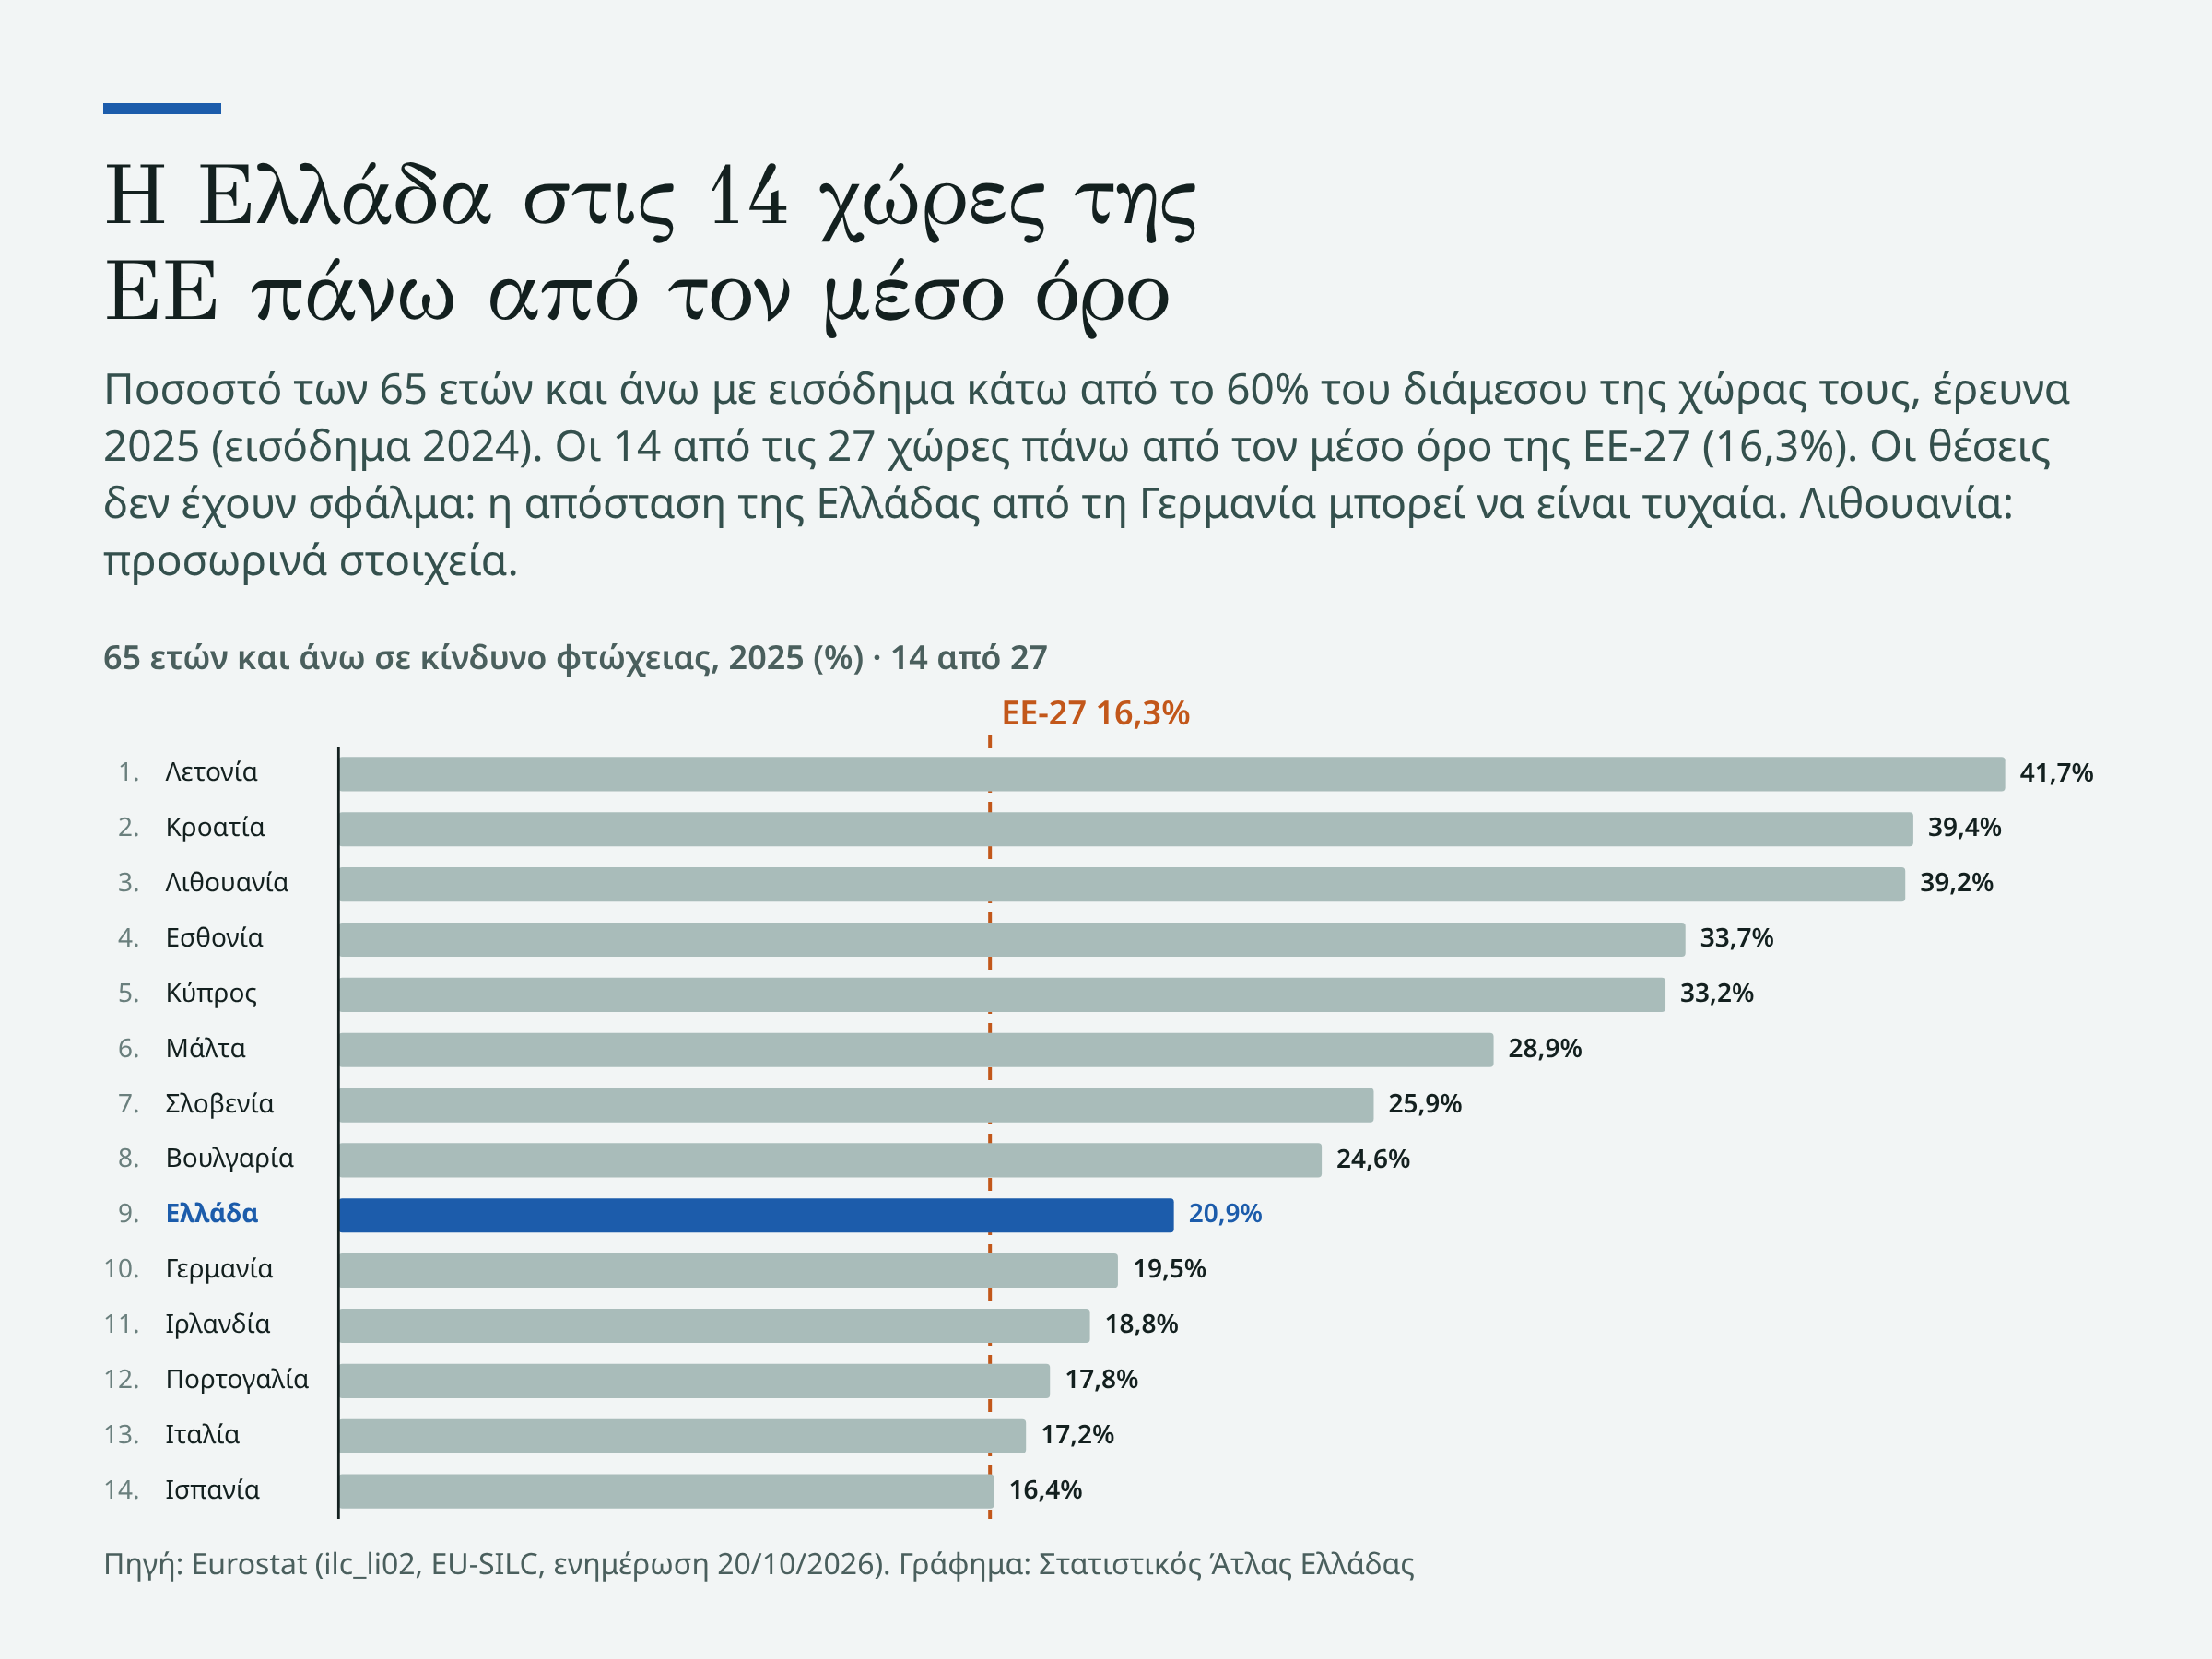
What sets Greece apart is not that those over 65 are above the average, but the change of position. In the ranking from the highest risk, Greece was 21st of 27 in 2018 and 9th in 2025, the largest move in the EU; the comparison passes through the 2023 change and is indicative. In points the rise was not the largest: in 2023–2025, with no method-change flag for Greece, the 3.3 points were the fourth, after Slovenia, Cyprus and Croatia, which has a flag.
Unemployment fell, the overall risk stayed
Each survey measures the previous year’s income. In income years 2022 to 2024 unemployment fell from 12.5% to 10.1%, according to the Labour Force Survey. The employment rate for ages 20 to 64 rose from 66.3% to 69.3%.
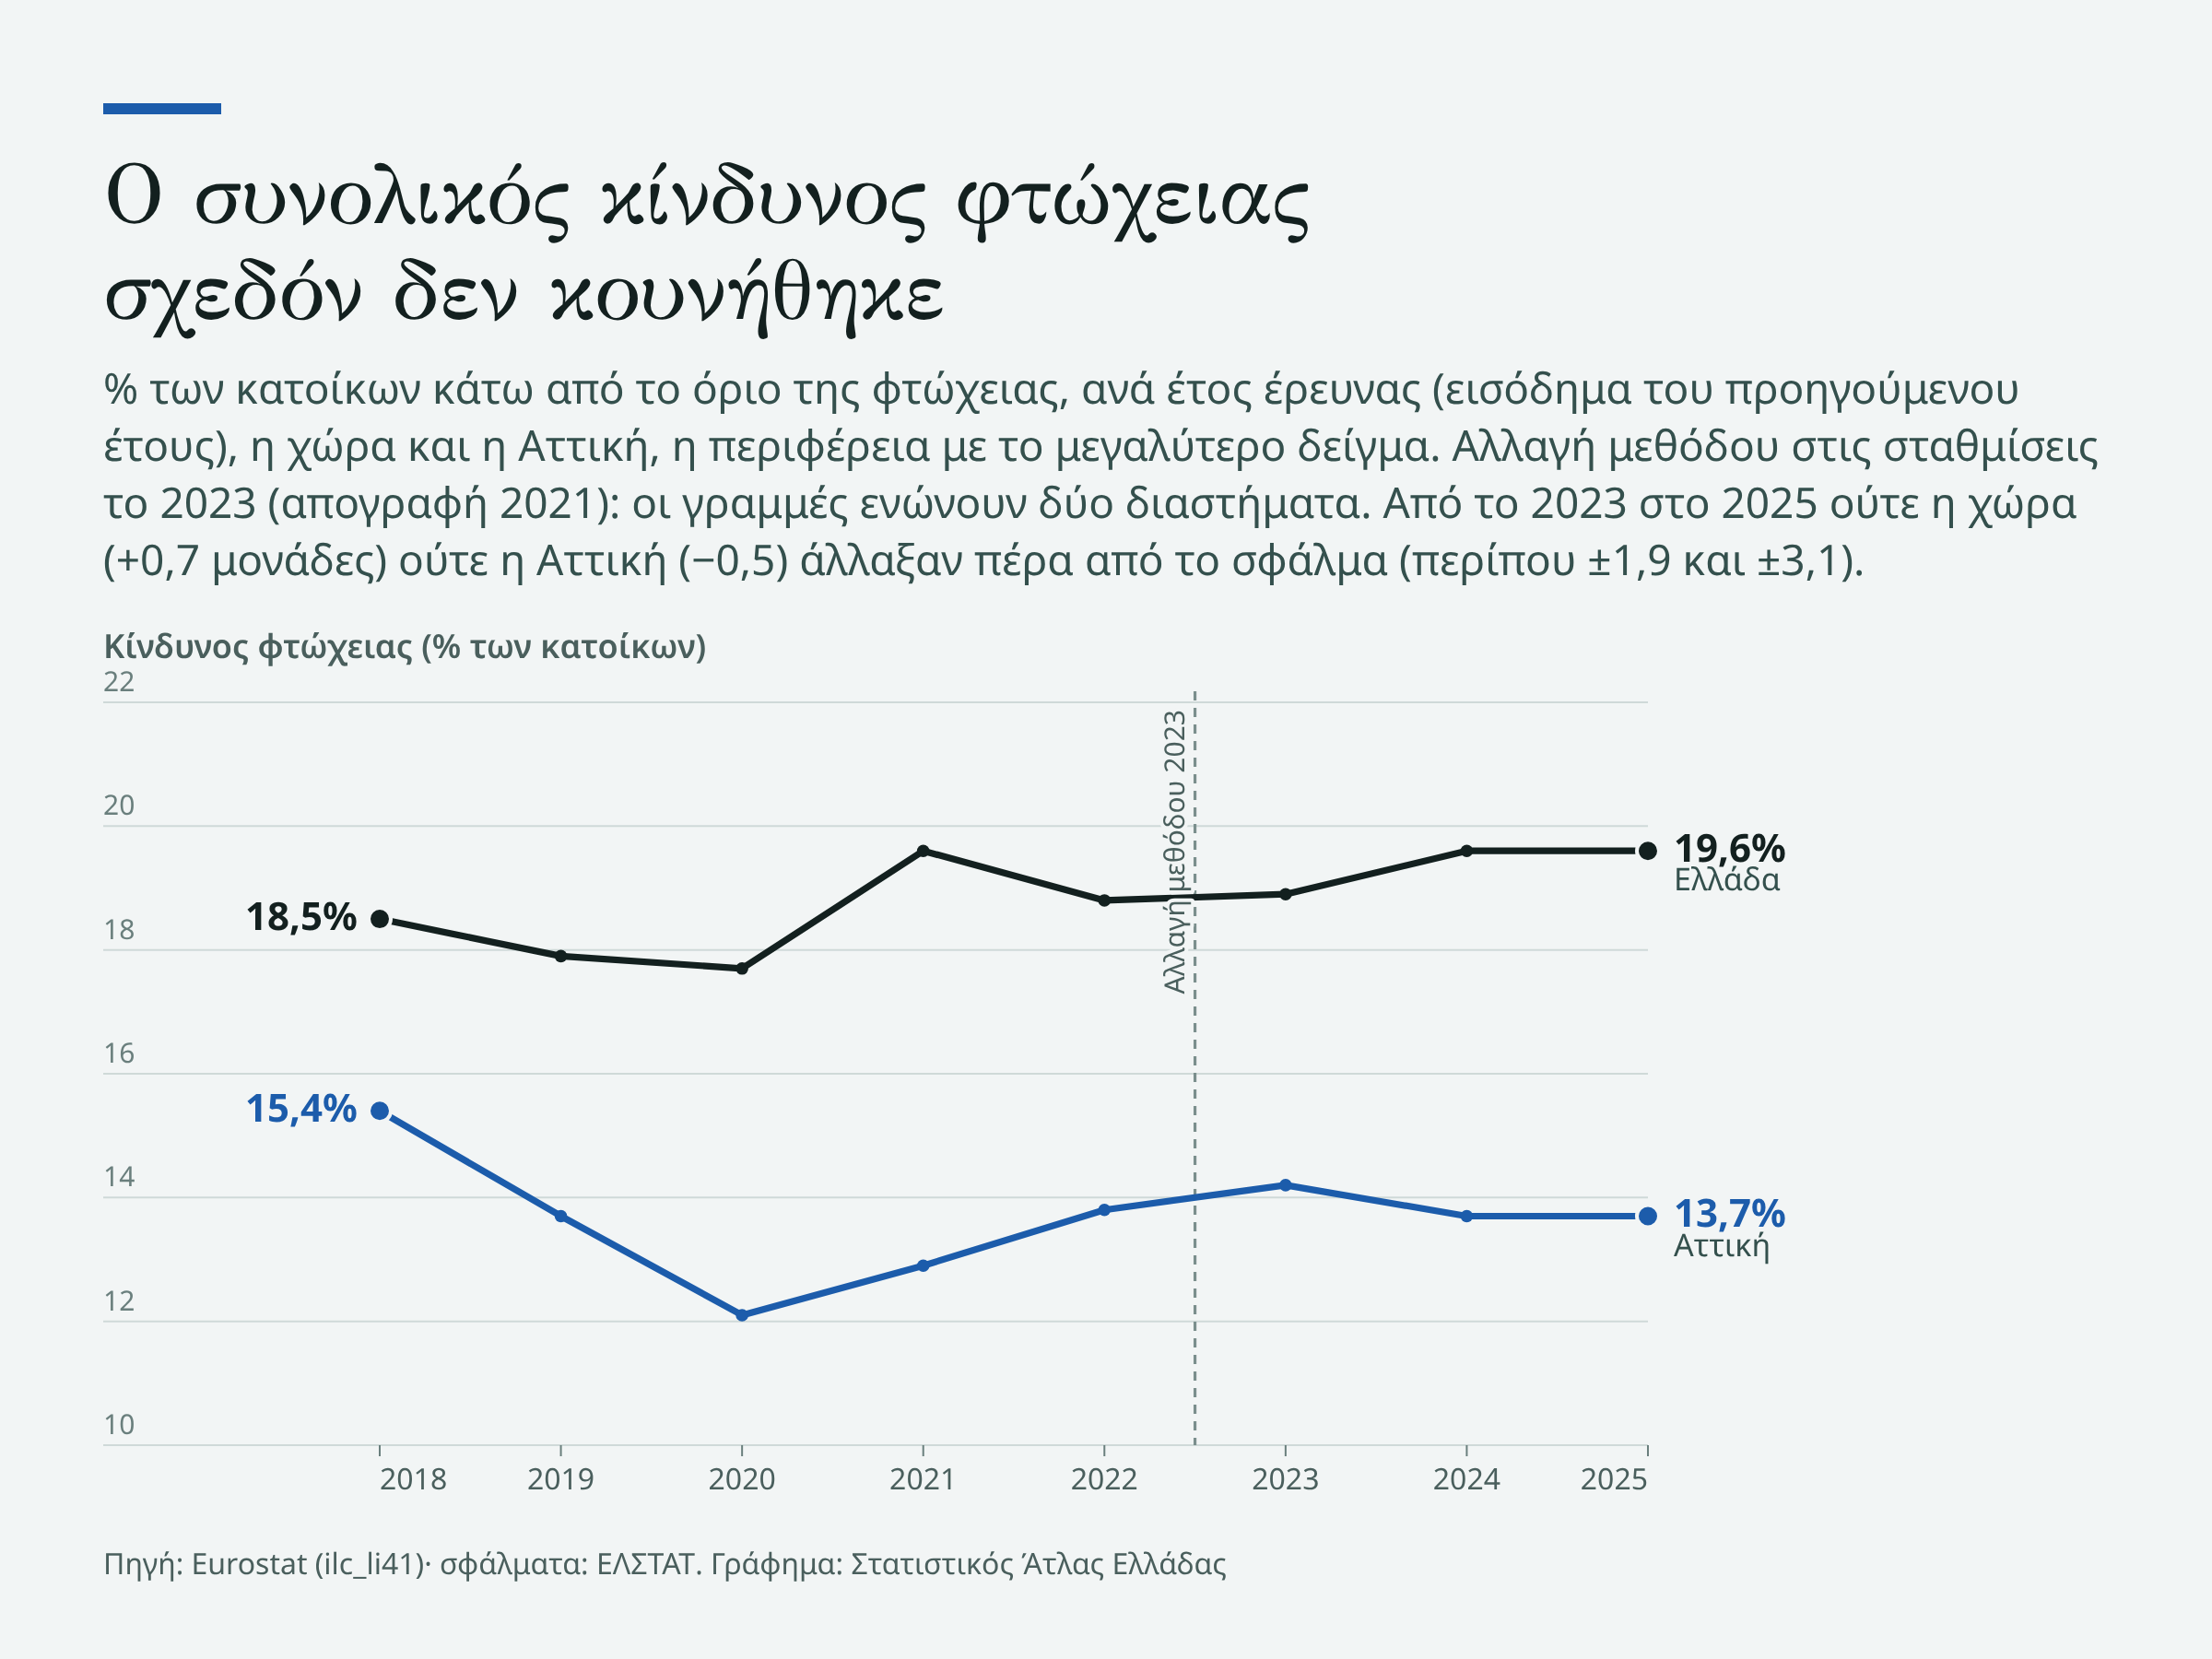
The poverty risk for the whole population went from 18.9% in the 2023 survey to 19.6% in the 2025 survey, a change smaller than the error of about 1.9 points. The chart also shows Attica, with the largest sample, where the risk also did not change beyond the error. The data show only that more work coexisted with a roughly stable overall risk, not whether they are linked.
Five regions stand out, the other eight do not
By region the error counts for even more: in 2025 in Western Macedonia only 248 households responded, in Attica 3,024. In Attica the poverty risk was 13.7% (11.7–15.7%) and in Crete 12.7% (8.8–16.5%): only in these two regions is the entire confidence interval below the country.
The entire interval is above the country only in the Peloponnese, with 30.1% (24.2–36.0%), in Eastern Macedonia and Thrace, with 26.8% (20.3–33.3%), and in Central Macedonia, with 24.2% (20.1–28.2%).
For the other eight the difference is not certain: in Western Macedonia the interval runs from 12.3% to 31.0%. Nor did any region change since 2023 by more than the error allows: the largest change, 5.9 points in Central Greece, is within the margin of about 7.7 points.
Pensions, support and the cost of living
Since 1 January 2023 main pensions have risen every year based on the previous year’s growth and inflation, not above inflation. The increase was 7.75% in 2023 and from 2.4% to 3.0% in the following years. Those who have a «personal difference», an amount that arose when their pensions were recalculated under law 4387/2016, did not always receive the full increase: part of it was offset against the difference.
IOBE, in a bulletin of 30 June 2026, finds that «the average old-age pension remained broadly stable in real terms over the period 2019–2025». IOBE does not link this to the poverty risk, and the data do not allow us to do so: the pension is one of the household’s incomes, and in 2018–2022 the median income of those over 65 rose 17.8% above inflation.
The draft 2027 budget, submitted to Parliament on 5 October 2026, estimates the increase in pensions from January 2027 at 2.8%, with no offset against the personal difference. It is an estimate based on the draft’s forecasts, and the final rate is set by joint ministerial decision. According to the draft, from November 2026 the annual support rises to 400 euros net and is permanently extended to all pensioners over 65, with 270,000 new beneficiaries.
At the same time inflation was 5.0% in September 2026, according to ELSTAT. The draft forecasts 3.8% for the whole of 2026 and 2.6% for 2027. The 2025 survey, with income for 2024, shows neither the 2026 cost of living nor the draft’s measures.
What we do not know
Why those over 65 fell behind is not explained by any named source we found. ELSTAT does not publish standard errors by age for the years 2018–2020, so we cannot test the 2018–2022 rise as we do that of 2023–2025. Nor do we know how much the new weights of 2023 affected the indicator, because ELSTAT describes their effect as unknown.
The indicator also does not show how people see their own position: Athina Rautopoulou, in the «Economic Developments» of KEPE, notes that the poverty risk rate «remained relatively stable over time», while the share of those who say their household meets its needs with difficulty rose significantly in the crisis and stayed high.
In a relative indicator the position of each group is also judged by how much the incomes of others rise. The support of November 2026 will be shown by the 2027 survey and the 2027 increase by the 2028 survey.
How we measured it
We use the indicator after social transfers, from Eurostat’s national series by age, which for 2024 and 2025 gives the same values as ELSTAT.
ELSTAT does not give errors for changes; using each year’s standard errors and the assumption of independent samples, we calculated that the rise for those over 65 in 2023–2025 was between 1.5 and 5.1 points. In 2025 ELSTAT also changed the estimation of employers’ contributions in income, with an effect it also describes as unknown.
We calculated the real changes in the threshold and the median income using the Harmonised Index of Consumer Prices of the income years, that is, the year before each survey.
Unemployment and employment are from the Labour Force Survey, whose definitions changed from 2021 with Regulation (EU) 2019/1700, and Eurostat notes a break in the series in 2021; the years we compare (2022 and 2024) are after the change. For EU countries, for the years 2018, 2023 and 2025 that we compare, Eurostat notes a change of method only for Croatia (2023), Luxembourg and Slovakia (2025), and provisional data for Lithuania (2025); for Croatia it notes a change in 2024 as well.
Sources: Eurostat, ELSTAT, IOBE, diaNEOsis, KEPE (Centre of Planning and Economic Research), Ministry of National Economy and Finance.