The first half of 2026 brought about as many births as the same period last year. The more useful reading is a different one: since 2013 the fall mainly reflects there being fewer and older women, and the same smaller generation is now visible in the labour market too.
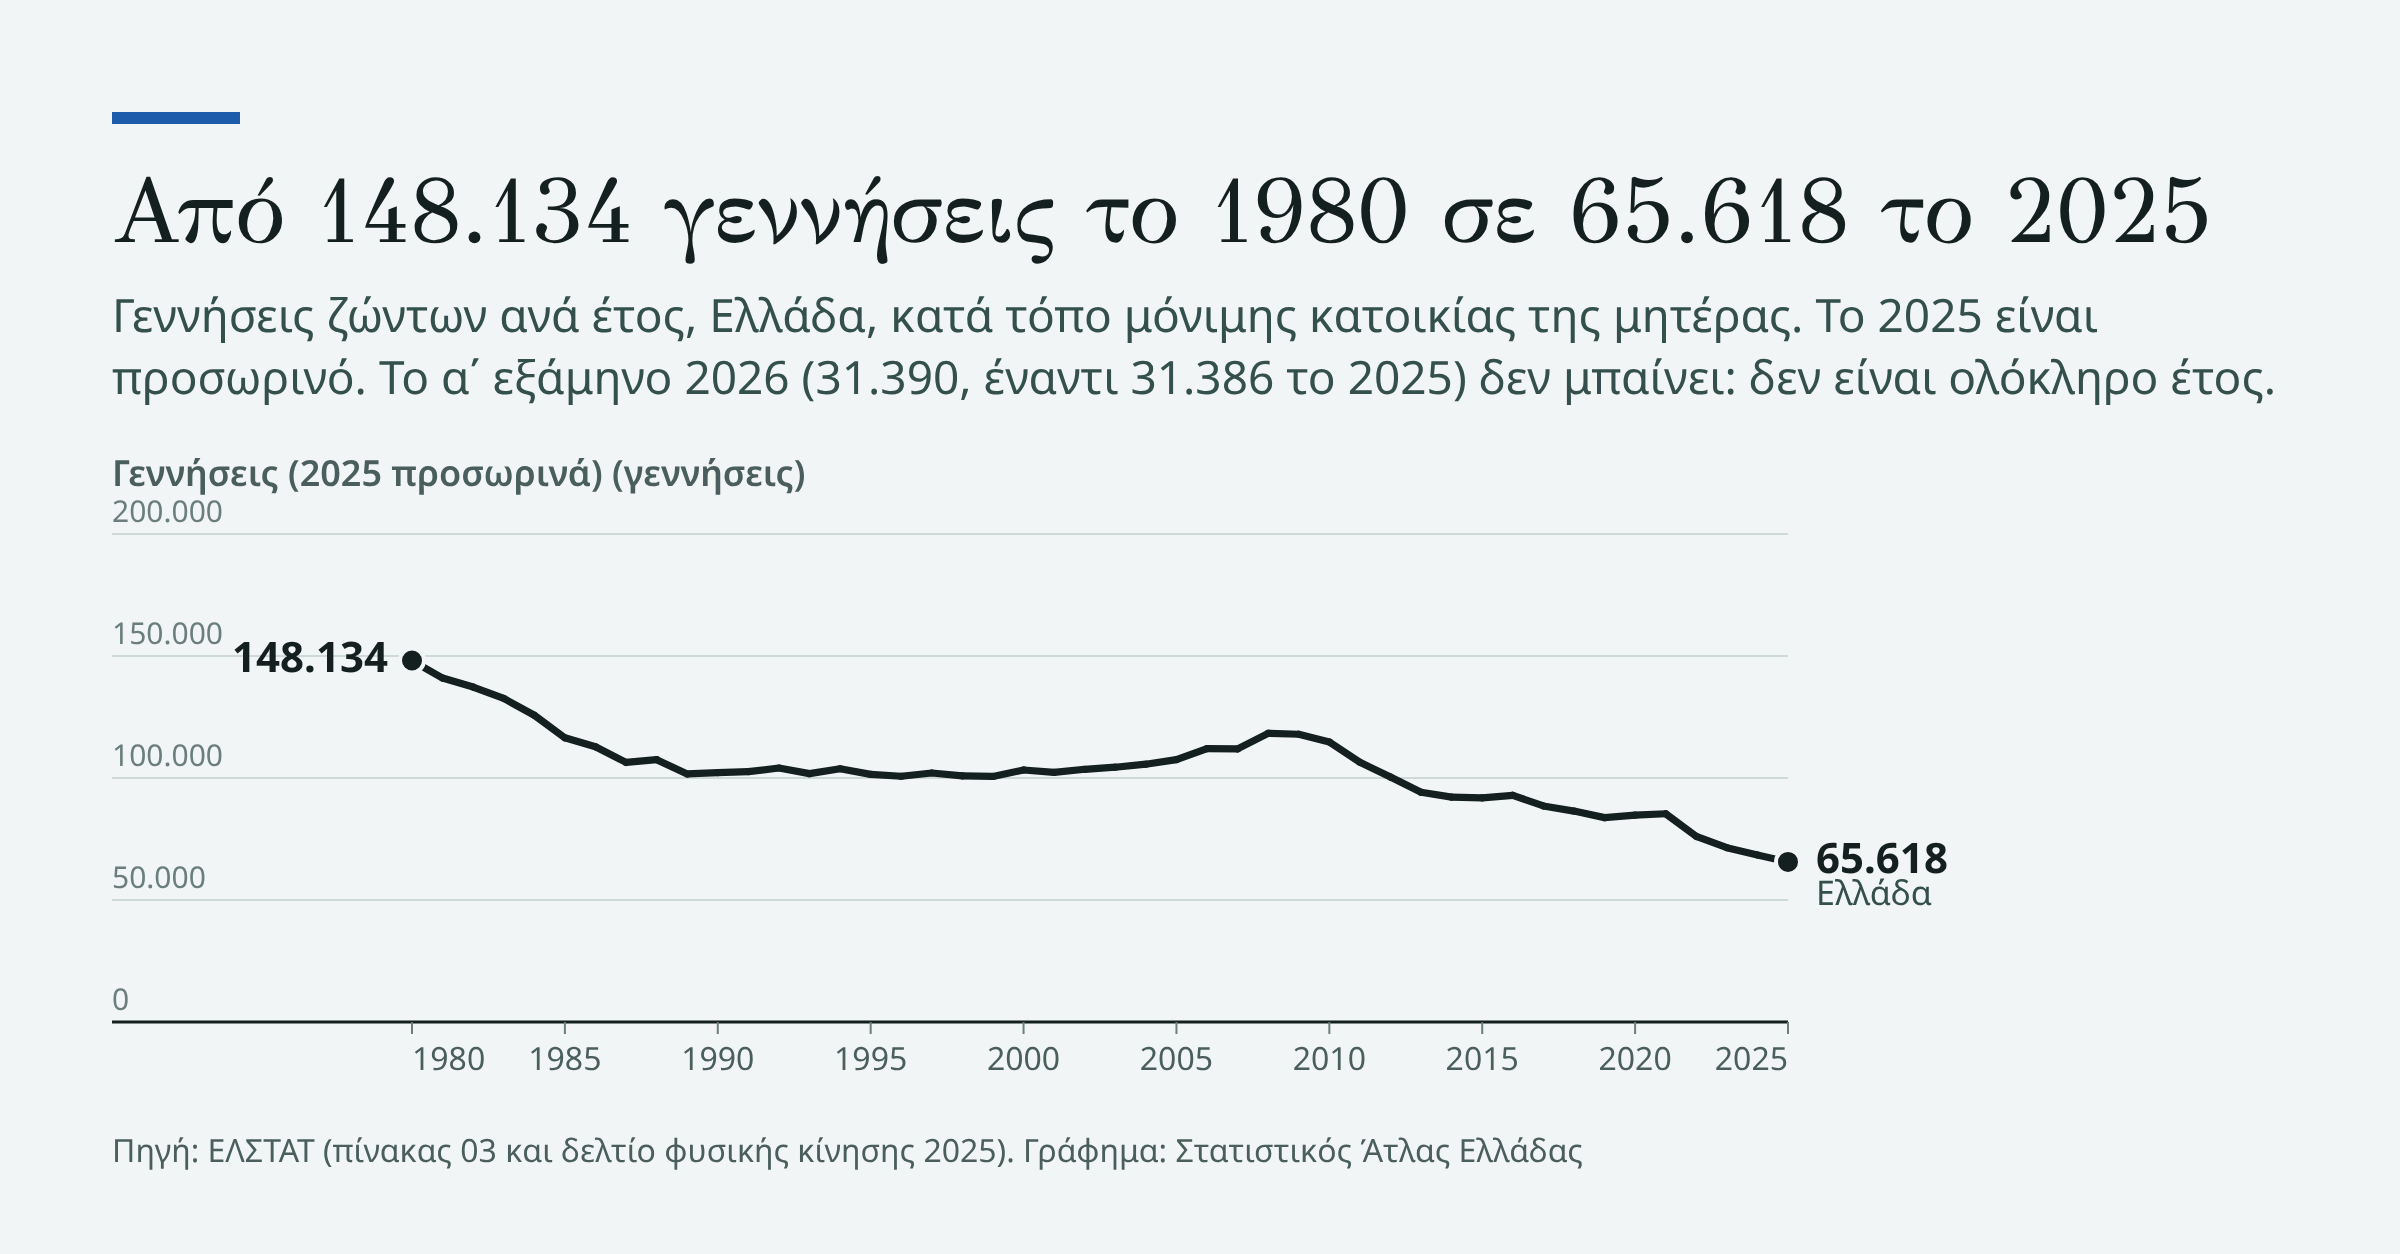
For every 100 babies born in Greece in 2008, the year with the most births since 1984, about 55 were born in 2025. That was 65,618 children, according to ELSTAT’s provisional data, or 44.5% fewer. Our own analysis of Eurostat data (births by age of mother and female population aged 15-49 by age) shows that from 2013 to 2024 more than 90% of the fall in births is explained by there being fewer and older women, and less than 10% by each age group having fewer children.
This changes the question: it is not only a matter of how many children each woman has, but also of how many women there are. And it shows why one half-year without a fall is not enough to speak of a turnaround.
Four births do not make a trend
On 24 September ELSTAT announced 31,390 births for the first half of 2026, against 31,386 in the same period of 2025. The difference is four births out of more than 31,000, that is, practically no change, in provisional data that ELSTAT classifies as statistics under development. Births increased in 7 of the 13 regions.
The corrections already made to the same data are larger than this difference. In ELSTAT’s release of 18 June 2026 for the whole of 2025, births for January–June 2025 add up to 31,378 (our own calculation from the monthly data). In the release of 24 September 2026 the same half-year appears with 31,386, eight more. Total live births for 2025 were 65,594 in ELSTAT’s provisional monthly release of 18 June 2026 and became 65,618 in the annual vital statistics release of 1 October 2026.
ELSTAT explains that late birth registrations are incorporated, after they are submitted, into the date of the event. Both corrections were upward, and the first half of 2026, being the most recent, had the least time to gather late registrations. If the pattern holds, the small rise is more likely to grow slightly than to disappear.
Years also go up and down. After 2008, annual births rose three times, in 2016, 2020 and 2021, but the rises did not last: falls followed in 2017 and 2022. A half-year without a fall is news. It is not yet a trend.
Fewer women, not mainly fewer children per woman
A year’s births depend on two things: how many women there are at each age and how many children each age group has on average. A simple demographic analysis separates them.
Women aged 25 to 39 numbered 1.14 million on 1 January 2013 and about 800,000 on 1 January 2025: three in ten fewer. Almost eight in ten of the births of 2025 occurred at these ages. And those who remain are older: among women aged 15 to 49, the share of those aged 40 to 49 rose from 33% in 2013 to 37% in 2024.
Suppose the women of 2024 had children at the age-specific rates of 2013, the year with the highest unemployment. About 69,000 children would have been born to mothers aged 15 to 49. 67,974 were born, that is, only about 1,000 fewer.
However, 2013 was also the year with the lowest fertility rate of the crisis, so this result depends on the starting point. Taking 2012 as the starting point, the share of the fall due to fewer and older women is 86%, with 2014 it is 93% and with 2015 it is 84%. In every case, the women count for more than the rates.
During the crisis the picture was the reverse. From 2008 to 2013 about 59% of the fall is due to lower rates and 41% to fewer women. This calculation is indicative, because Greece revised its population series for the years between the 2011 and 2021 censuses (the revisions were published in 2024/2025), while 2008 lies outside the revised period.
The demographer Byron Kotzamanis (IDEM) has pointed out that women became fewer: women aged 25 to 44 decreased by 480 thousand, or 28%, between 2008-09 and 2025-26. He attributes this mainly to the less numerous generations born after 1980 reaching these ages and, secondarily, to emigration. These generations can be seen in the first chart: in 1980, 148,134 children were born, in 1990 about three in ten fewer.
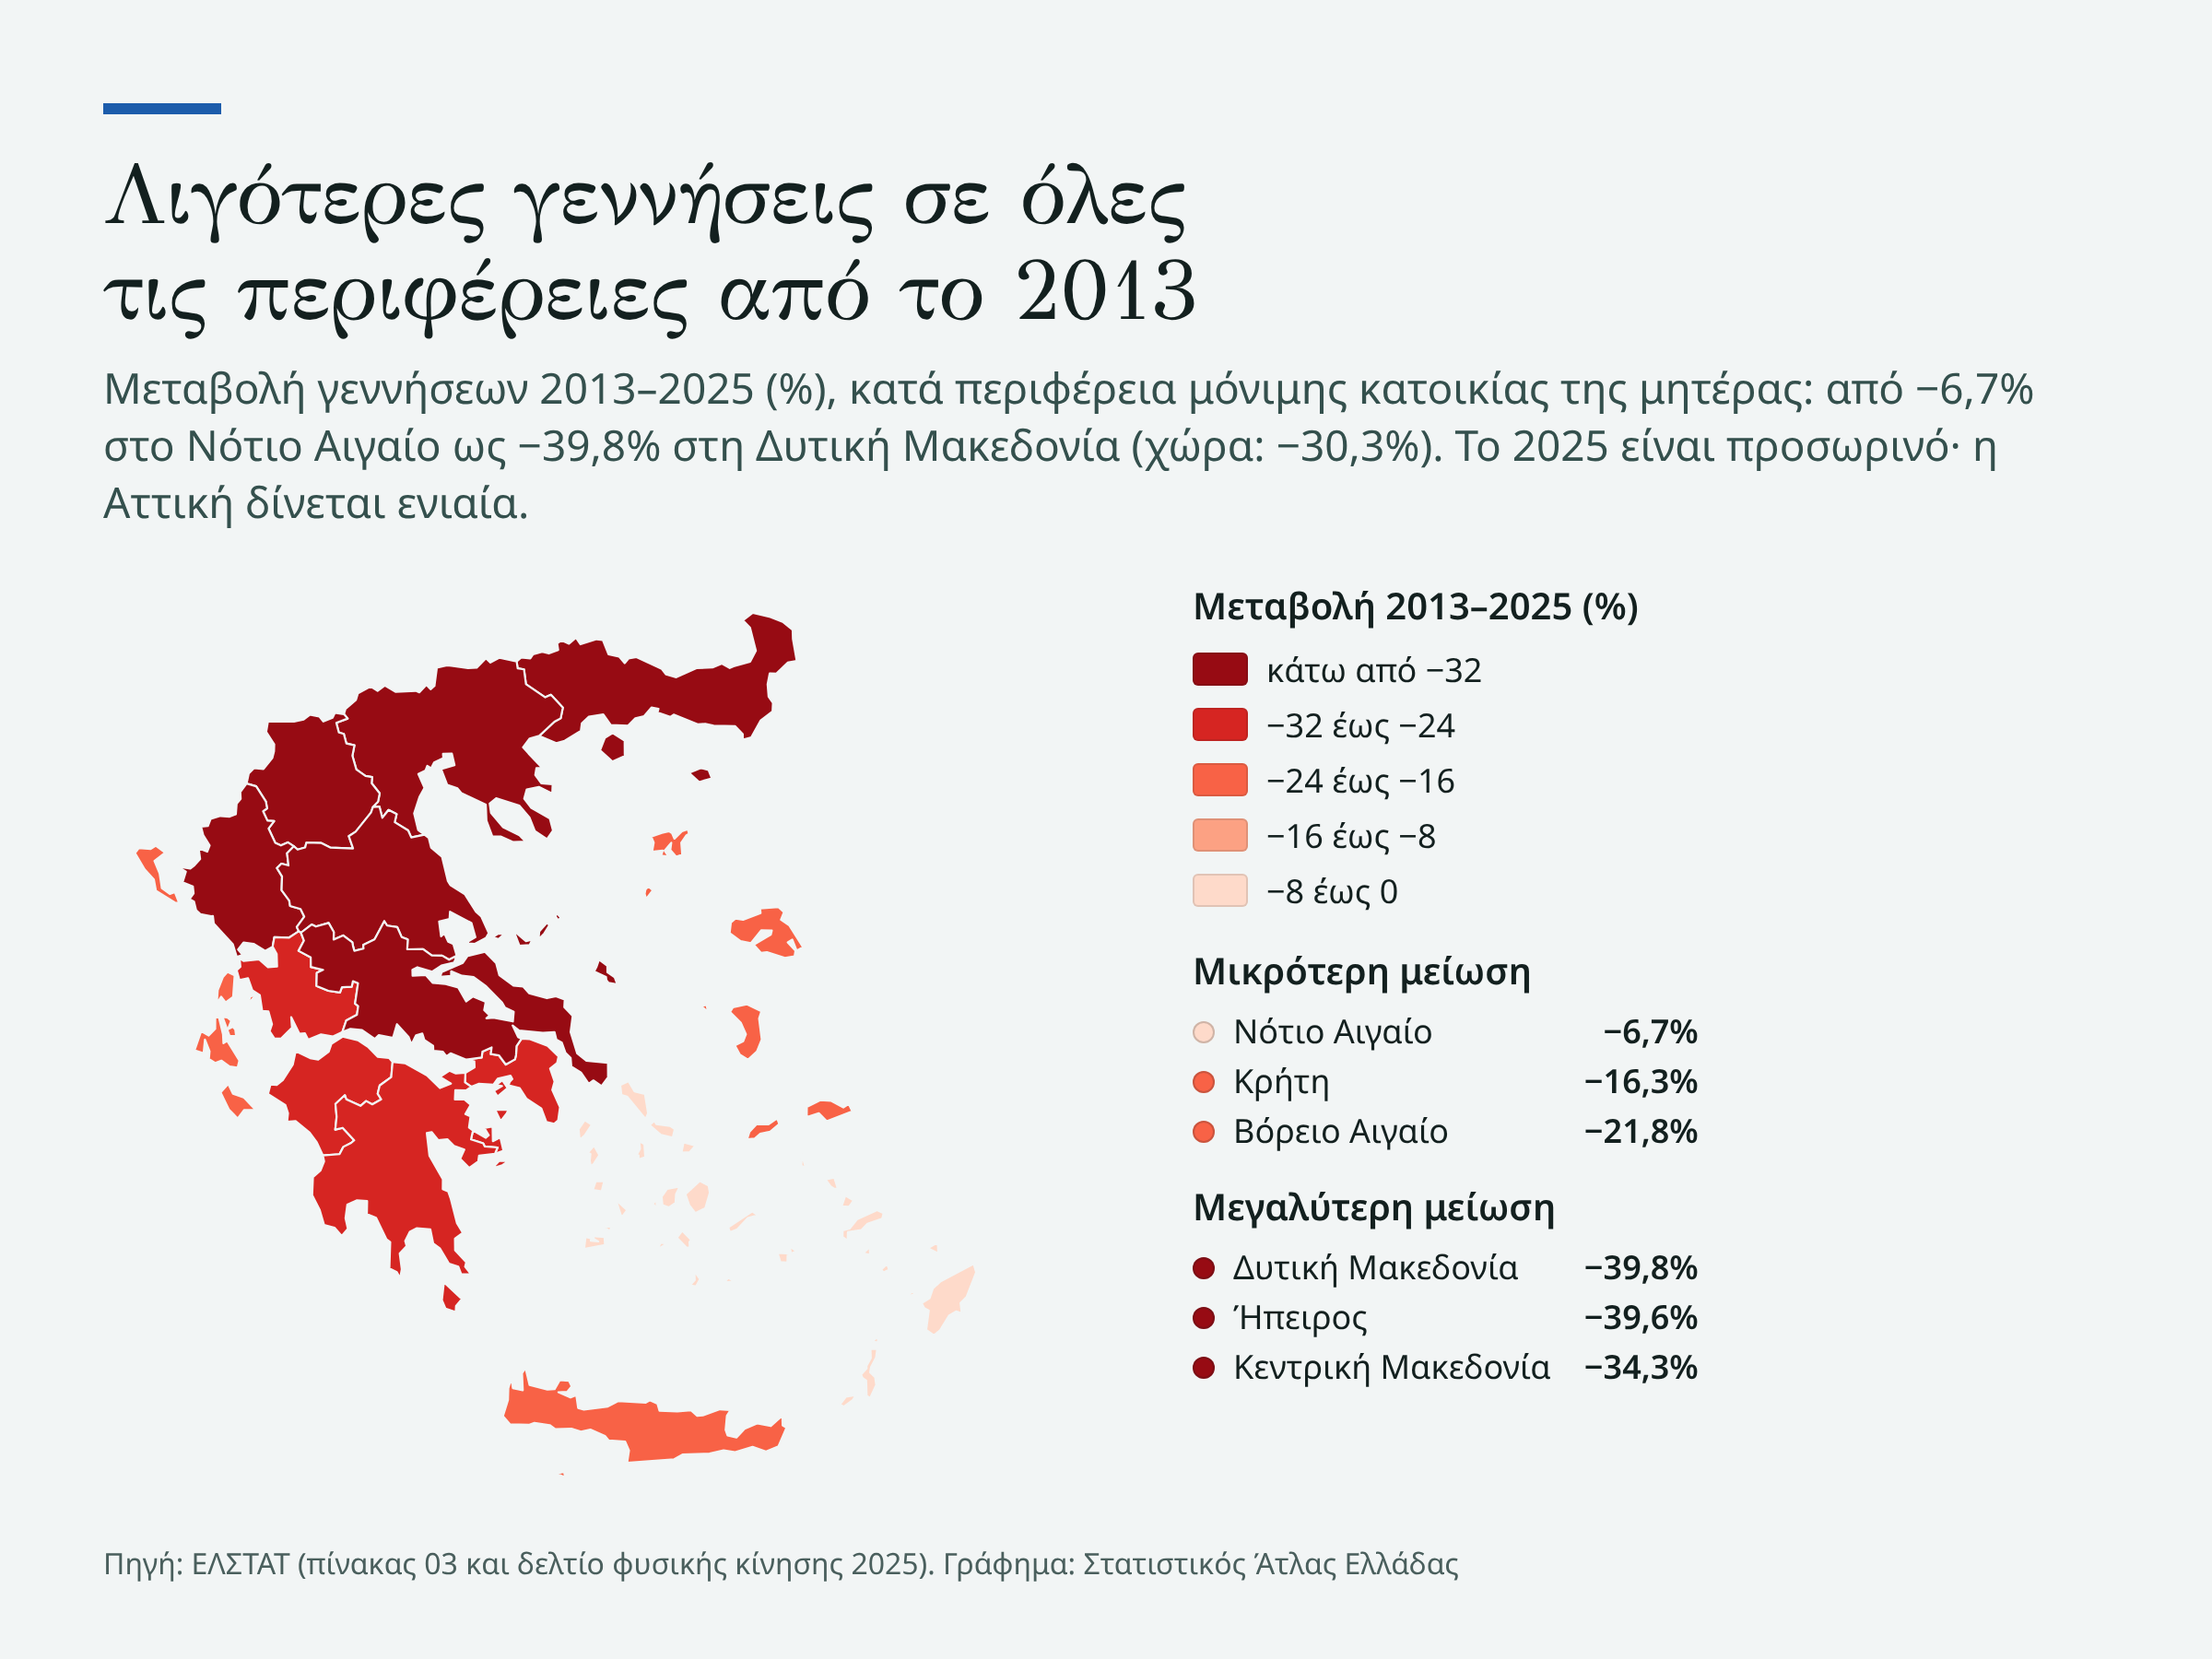
The fall is everywhere. In all 13 regions births in 2025 were fewer than in 2013, and in the country as a whole 30.3% fewer. The smallest fall was in the South Aegean, 6.7%. The largest was in Western Macedonia, 39.8%.
Finland shows the difference
From 2008 to 2024 Greece had the second-largest fall in births in the EU-27, after Latvia. In the fertility rate, however, its decline, 0.26 children per woman, shares only 14th place with Italy.
Between 2008 and 2024 Finland lost more fertility than Greece, 0.60 children per woman, but fewer births, 26.6% against 42.3%. In Finland women aged 25 to 39 increased by 9.9% over the same period, while in Greece they decreased by 34.1%, among the largest decreases in the EU, together with Bulgaria. For Greece, comparisons with 2008 pass through the population revision for the years 2011–2021 and through the break in the fertility rate series in 2021, so the rankings are indicative. The direction, however, is clear: what counts is how many women there are.
The same generation in the labour market
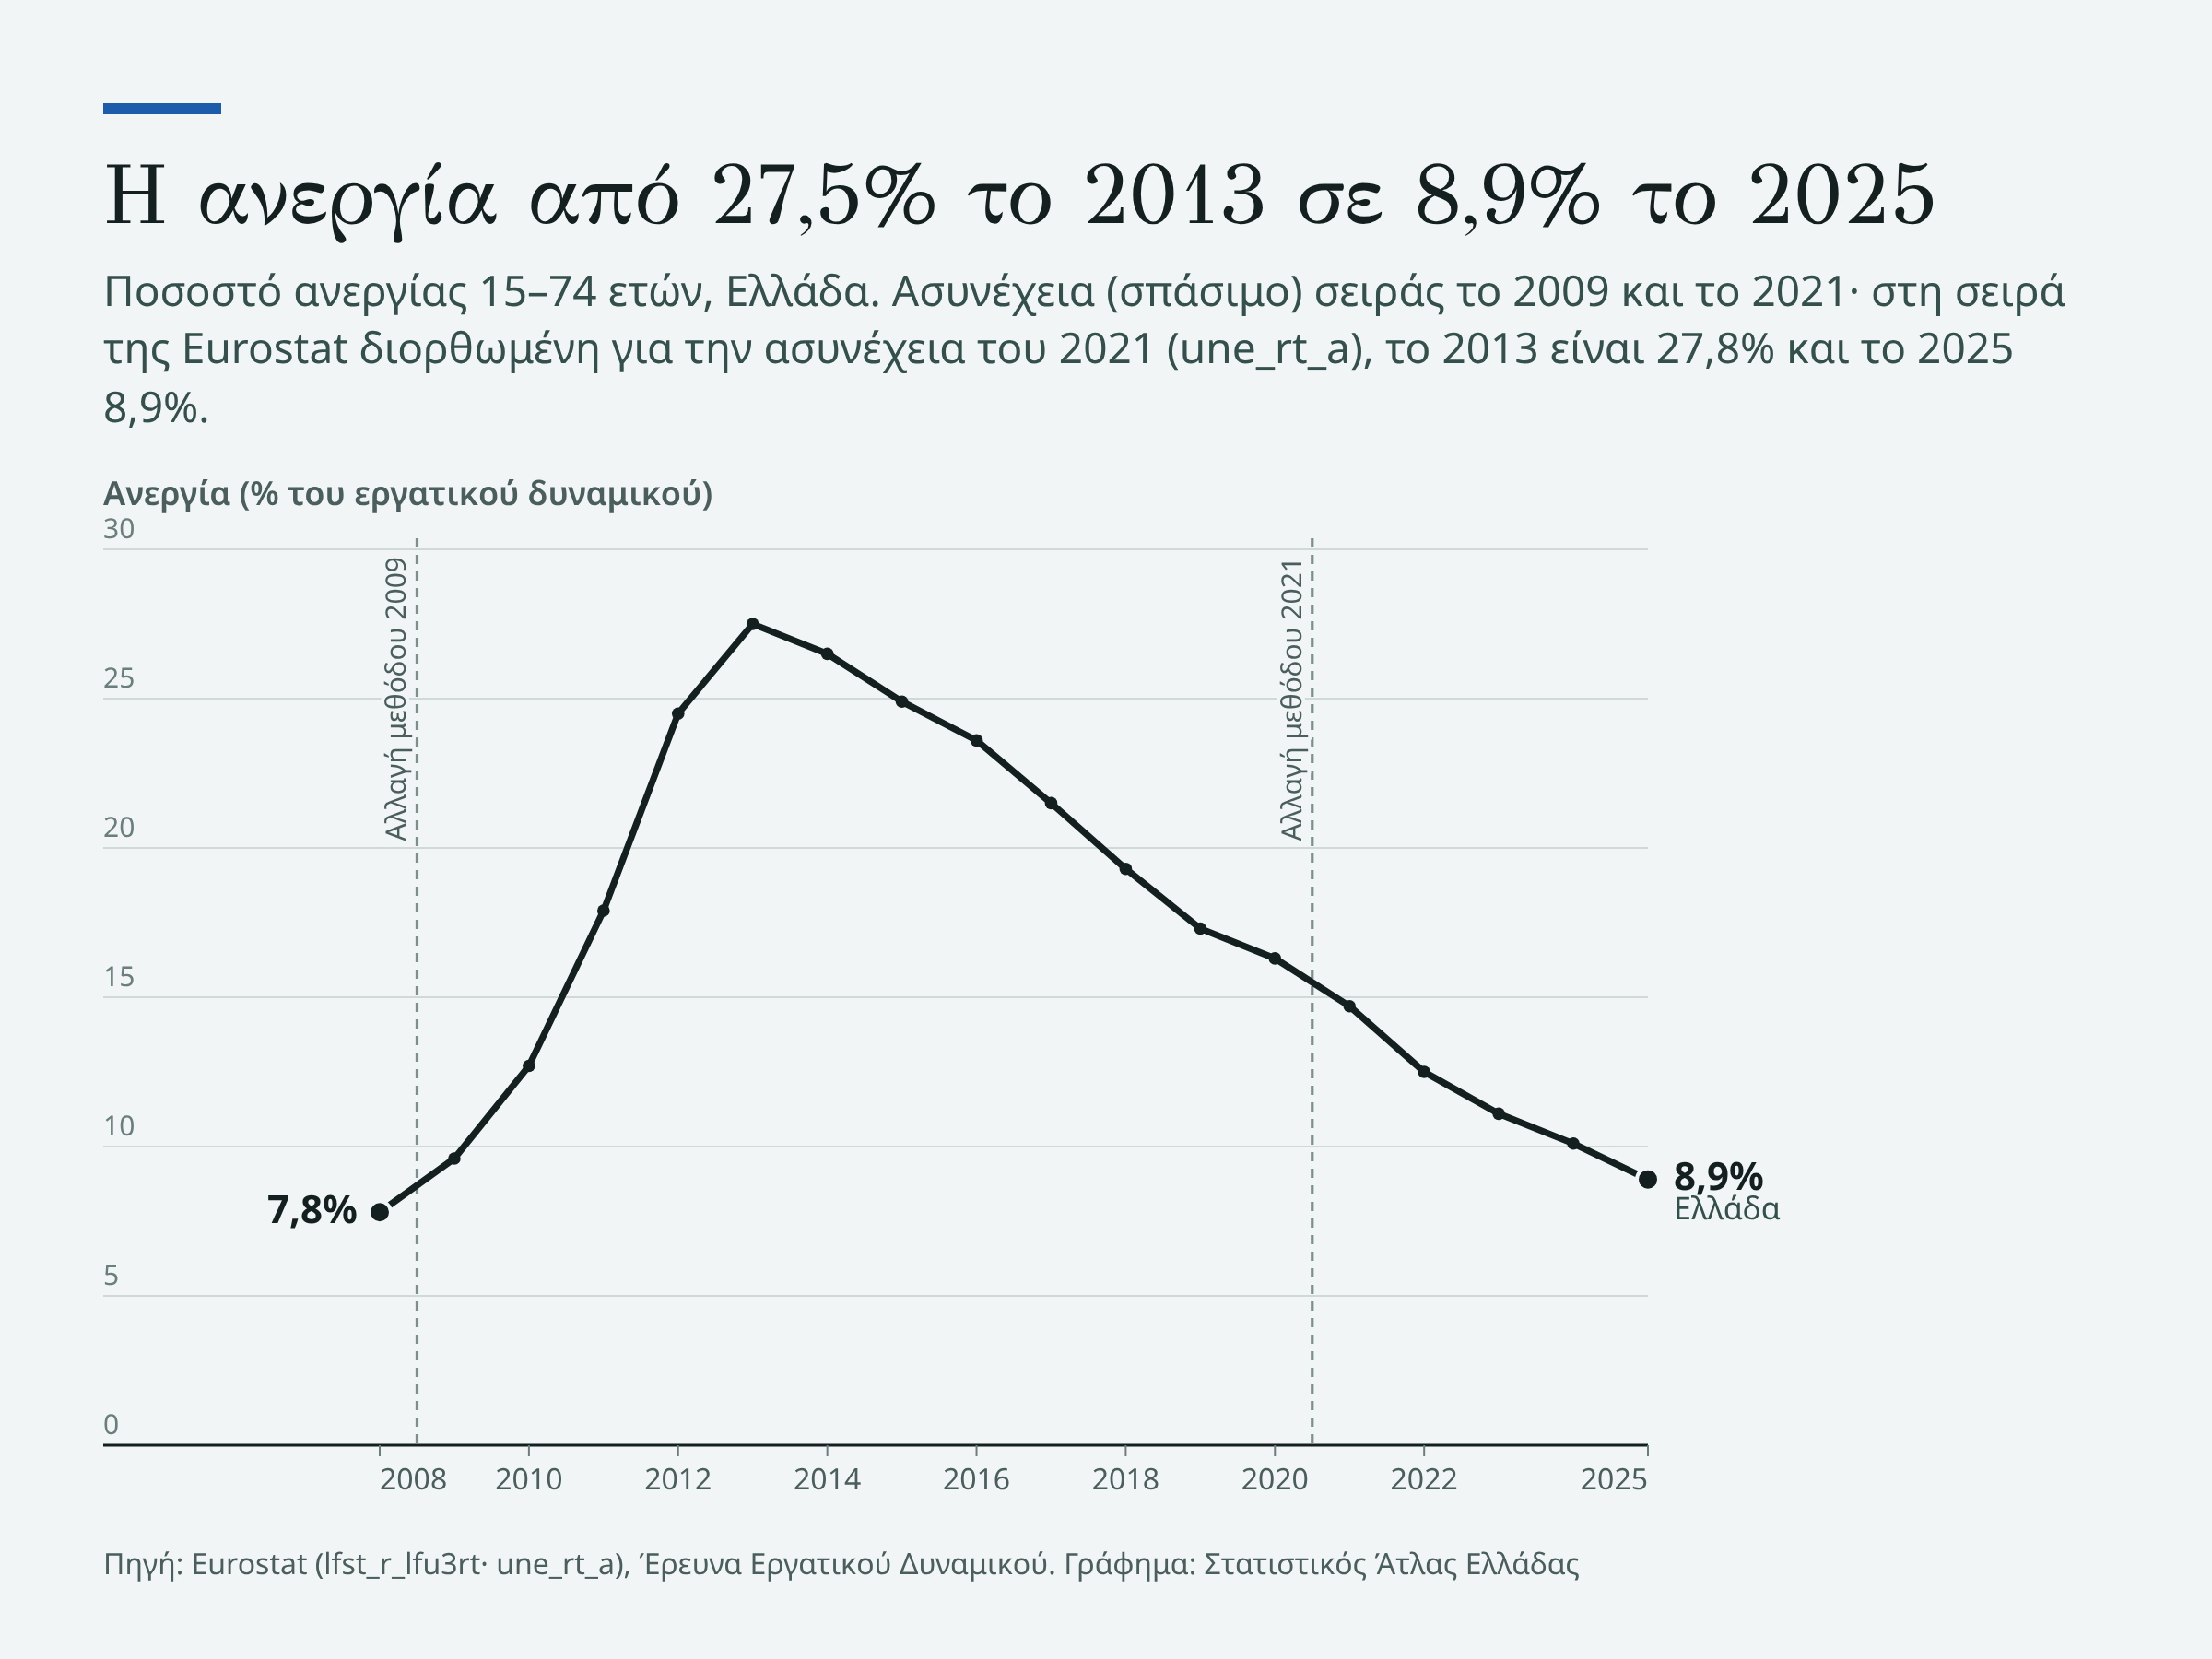
The labour market shows the same generation from another side. In 2025 unemployment was 8.9%, about one third of 2013. The Eurostat series that corrects the 2021 break (for the years from 2009) gives 27.8% for 2013 and 8.9% for 2025.
Since 2021, with the same method, unemployment among women aged 30 to 34 fell by half, from 24.5% to 12.3%, while the overall rate fell from 14.7% to 8.9%. Employed women aged 25 to 39 increased, by about 26,000. Their labour force, however, that is, those who work or look for work, decreased by 8%, while the women of this age themselves became fewer by about 12%. More are working, but from a smaller pool.
The comparison with 2013 passes through the series break in 2021 and is only indicative, but it shows that employed women aged 25 to 39 are fewer today than at the bottom of the crisis. With the same method, since 2021, the smaller generation that is missing from the maternity hospitals is also visible in the labour market.
Anna Matysiak, Tomáš Sobotka and Daniele Vignoli found, in a study of European regions, that the fall in fertility during the Great Recession was closely related to the rise in unemployment. Alexandra Tragaki and Christos Bagavos note that with the recovery fertility rises more weakly and more slowly than it fell in the recession, and that their analysis cannot prove causation. Fertility, however, also fell in the 2010s in the Nordic countries, and a study led by Chiara Ludovica Comolli concludes that the start of that fall appears to be linked to the 2008–2009 recession, while its continuation is not easily linked to the economy.
If we put the data side by side, unemployment fell to one third of its crisis peak. Overall, fertility rates stayed close to those of 2013, although they shifted towards older ages. Births continued to fall, and from 2013 to 2024 their fall corresponds almost entirely to there being fewer and older women. The data do not prove that unemployment caused any of this, or that its fall will correct it.
What this means for those who plan
The smaller generations are not a forecast; they have already been born, and those who plan schools, hiring, insurance or housing can see them years ahead. At school the fewer births of the crisis are already visible: the Minister of Education Sofia Zacharaki stated in May, according to alfavita, that enrolments in the first grade of primary school fell from about 100,000 in 2016 to about 70,000 in 2026.
Official projections struggle with the other half of the equation. Eurostat’s EUROPOP2023 projection assumed 804,358 women aged 25 to 39 for 1 January 2025, very close to the 800,278 recorded. For births in 2025, however, it assumed 76,037, while ELSTAT recorded 65,618. It calculated the women, who were already born, correctly. The children it did not: for 2025 it assumed a fertility rate of 1.42.
There is also a counterweight. Girls aged 15 to 19 were about 266,000 on 1 January 2025, more than women aged 25 to 29, who were about 245,000. These are the generations of 2005 to 2009, when more than 100,000 children were born every year. Girls aged 0 to 4, however, number about 188,000, 28% fewer than women aged 30 to 34. Kotzamanis has written that a return of births to the levels of 2011–2020 is «impossible as the population of women of reproductive age will continue to decrease». The generations of 2005–2009 give a margin, not a reversal.
What we do not know
We do not know whether the first half of 2026 will hold. The September release runs up to June and does not say how much provisional data usually change.
Our calculation separates the women from the rates, but it does not separate the smaller generations from emigration. We did not find a Greek study on unemployment and fertility after 2015, nor a study that proves causation for Greece in 2025.
How we measured it
The atlas births are, in all years, live births by the mother’s place of usual residence: for 1980–2024 from ELSTAT table 03 and for 2025 from table 2 of the annual release; ELSTAT describes the 2025 data as provisional in the monthly releases and notes that they may be revised. The half-year data count births in Greek territory, including mothers resident abroad, which is why we compare them only with the same half-year of another year.
For the analysis we used births by single year of mother’s age and the female population by age on 1 January, both from Eurostat. The rate for each age is births divided by the average of the women of that age at the start and end of the year. We split the change using the Kitagawa method, for ages 15 to 49: the population effect is the average of two calculations, with the rates of the initial and final year; what remains is the rates effect. Summing the rates reproduces Eurostat’s fertility rate with a deviation below 0.01, for example 1.237 against 1.242 in 2024.
Eurostat gives a slightly different number of births for Greece than ELSTAT, for example 68,309 against 68,467 in 2024. This is why in comparisons with other countries we use only Eurostat.
The atlas unemployment is the unemployment rate for ages 15 to 74 from the Labour Force Survey; Eurostat notes breaks in the series in 2001, 2004, 2005, 2009 and 2021, and in the 2008–2025 period used here the last two fall. EUROPOP2023 is a projection based on assumptions and not a forecast; we use only its baseline scenario.
Sources: Eurostat, ELSTAT.