The Greek share stayed almost flat at around 35%, while the EU’s rose. What the Eurostat data show and what they do not.
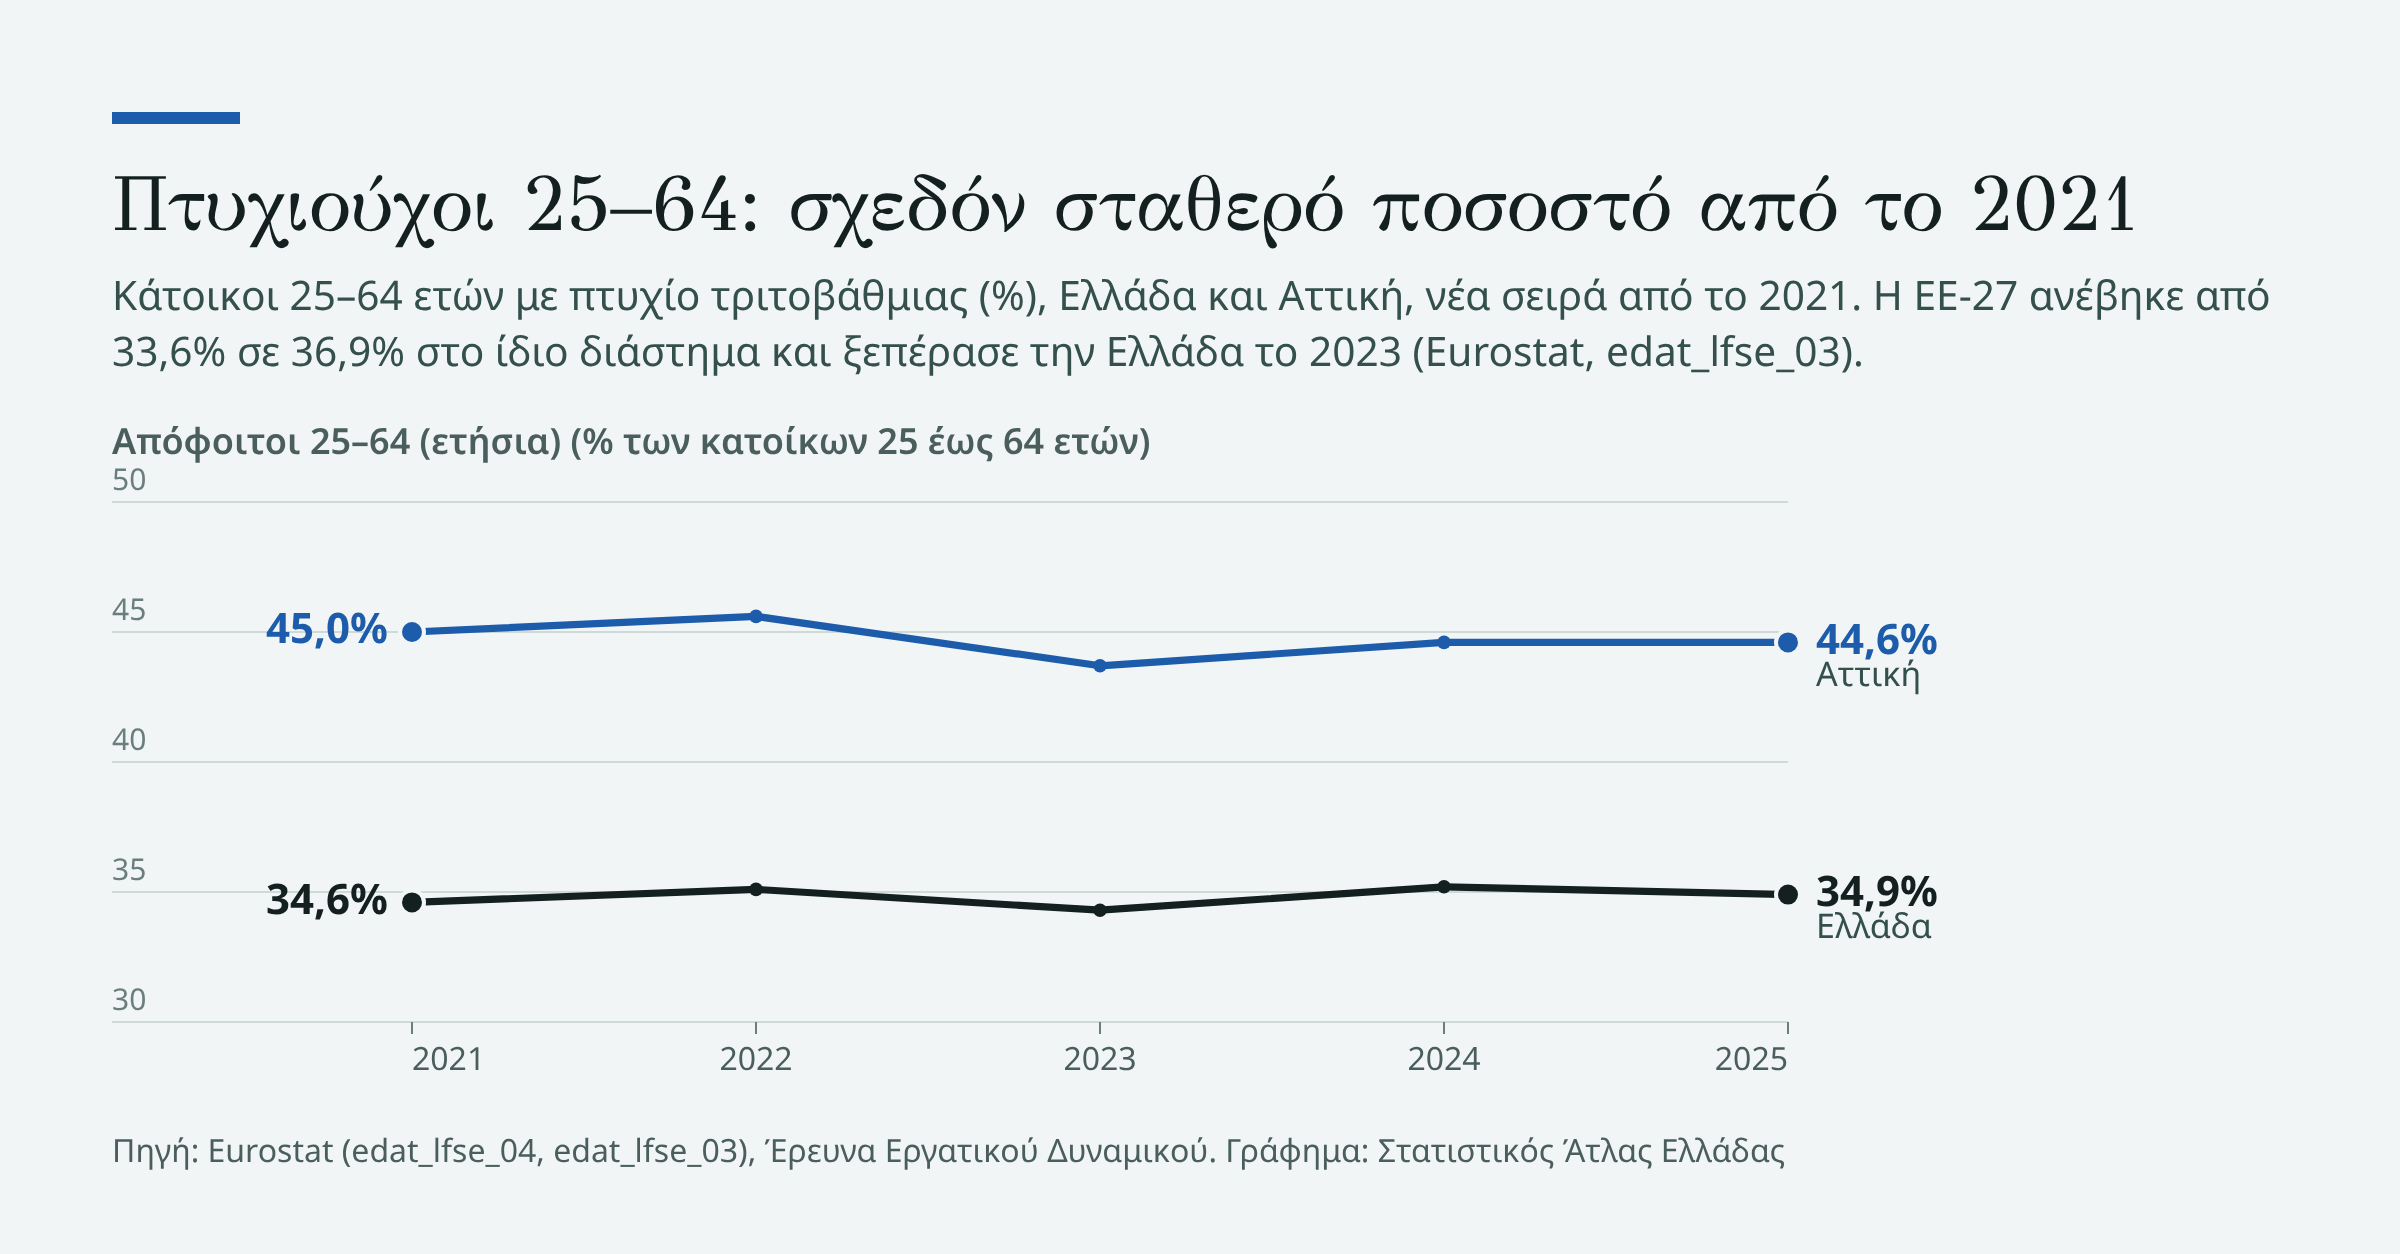
In 2025, 34.9% of residents of Greece aged 25 to 64 held a tertiary education degree. In the EU-27 the share was 36.9%, that is, 2.0 percentage points higher. In 2021 the order was reversed: Greece had 34.6% and the EU-27 33.6%. Greece did not fall, but stayed at almost the same point, while the EU average rose 3.3 points.
What the data show
From 2021 to 2025 the Greek share rose by only 0.3 percentage points. From year to year it moved more: from 2023 to 2024 it rose 0.9 points and in 2025 it fell back. This is why Greece is more accurately described as practically stagnant at around 35%.
The EU-27 average rose every year: 33.6%, 34.2%, 35.1%, 35.9% and 36.9%. Greece was above it in 2021 and 2022 and has been below it since 2023. In the ranking of the 27 member states for ages 25–64, in 2021 Greece was 15th, tied with Austria, and in 2025 it is 20th.
Eurostat announced that 44.8% of EU residents aged 25–34 held a tertiary degree in 2025 and that the EU is on track for the 45% target by 2030. Greece was above the EU average in this age group every year from 2021 to 2024 and fell below it in 2025, at 42.8%.
The picture differs by age. In 2025 Greece had a higher share of graduates than the EU only among those aged 55–64, 29.1% against 26.5%. In every ten-year age band from 25 to 54 it was below the EU, with the largest gap among those aged 45–54, 31.0% against 35.1%. So in the 25–64 total, the Greek share rests in part on the oldest group, those aged 55–64.
Large differences between regions
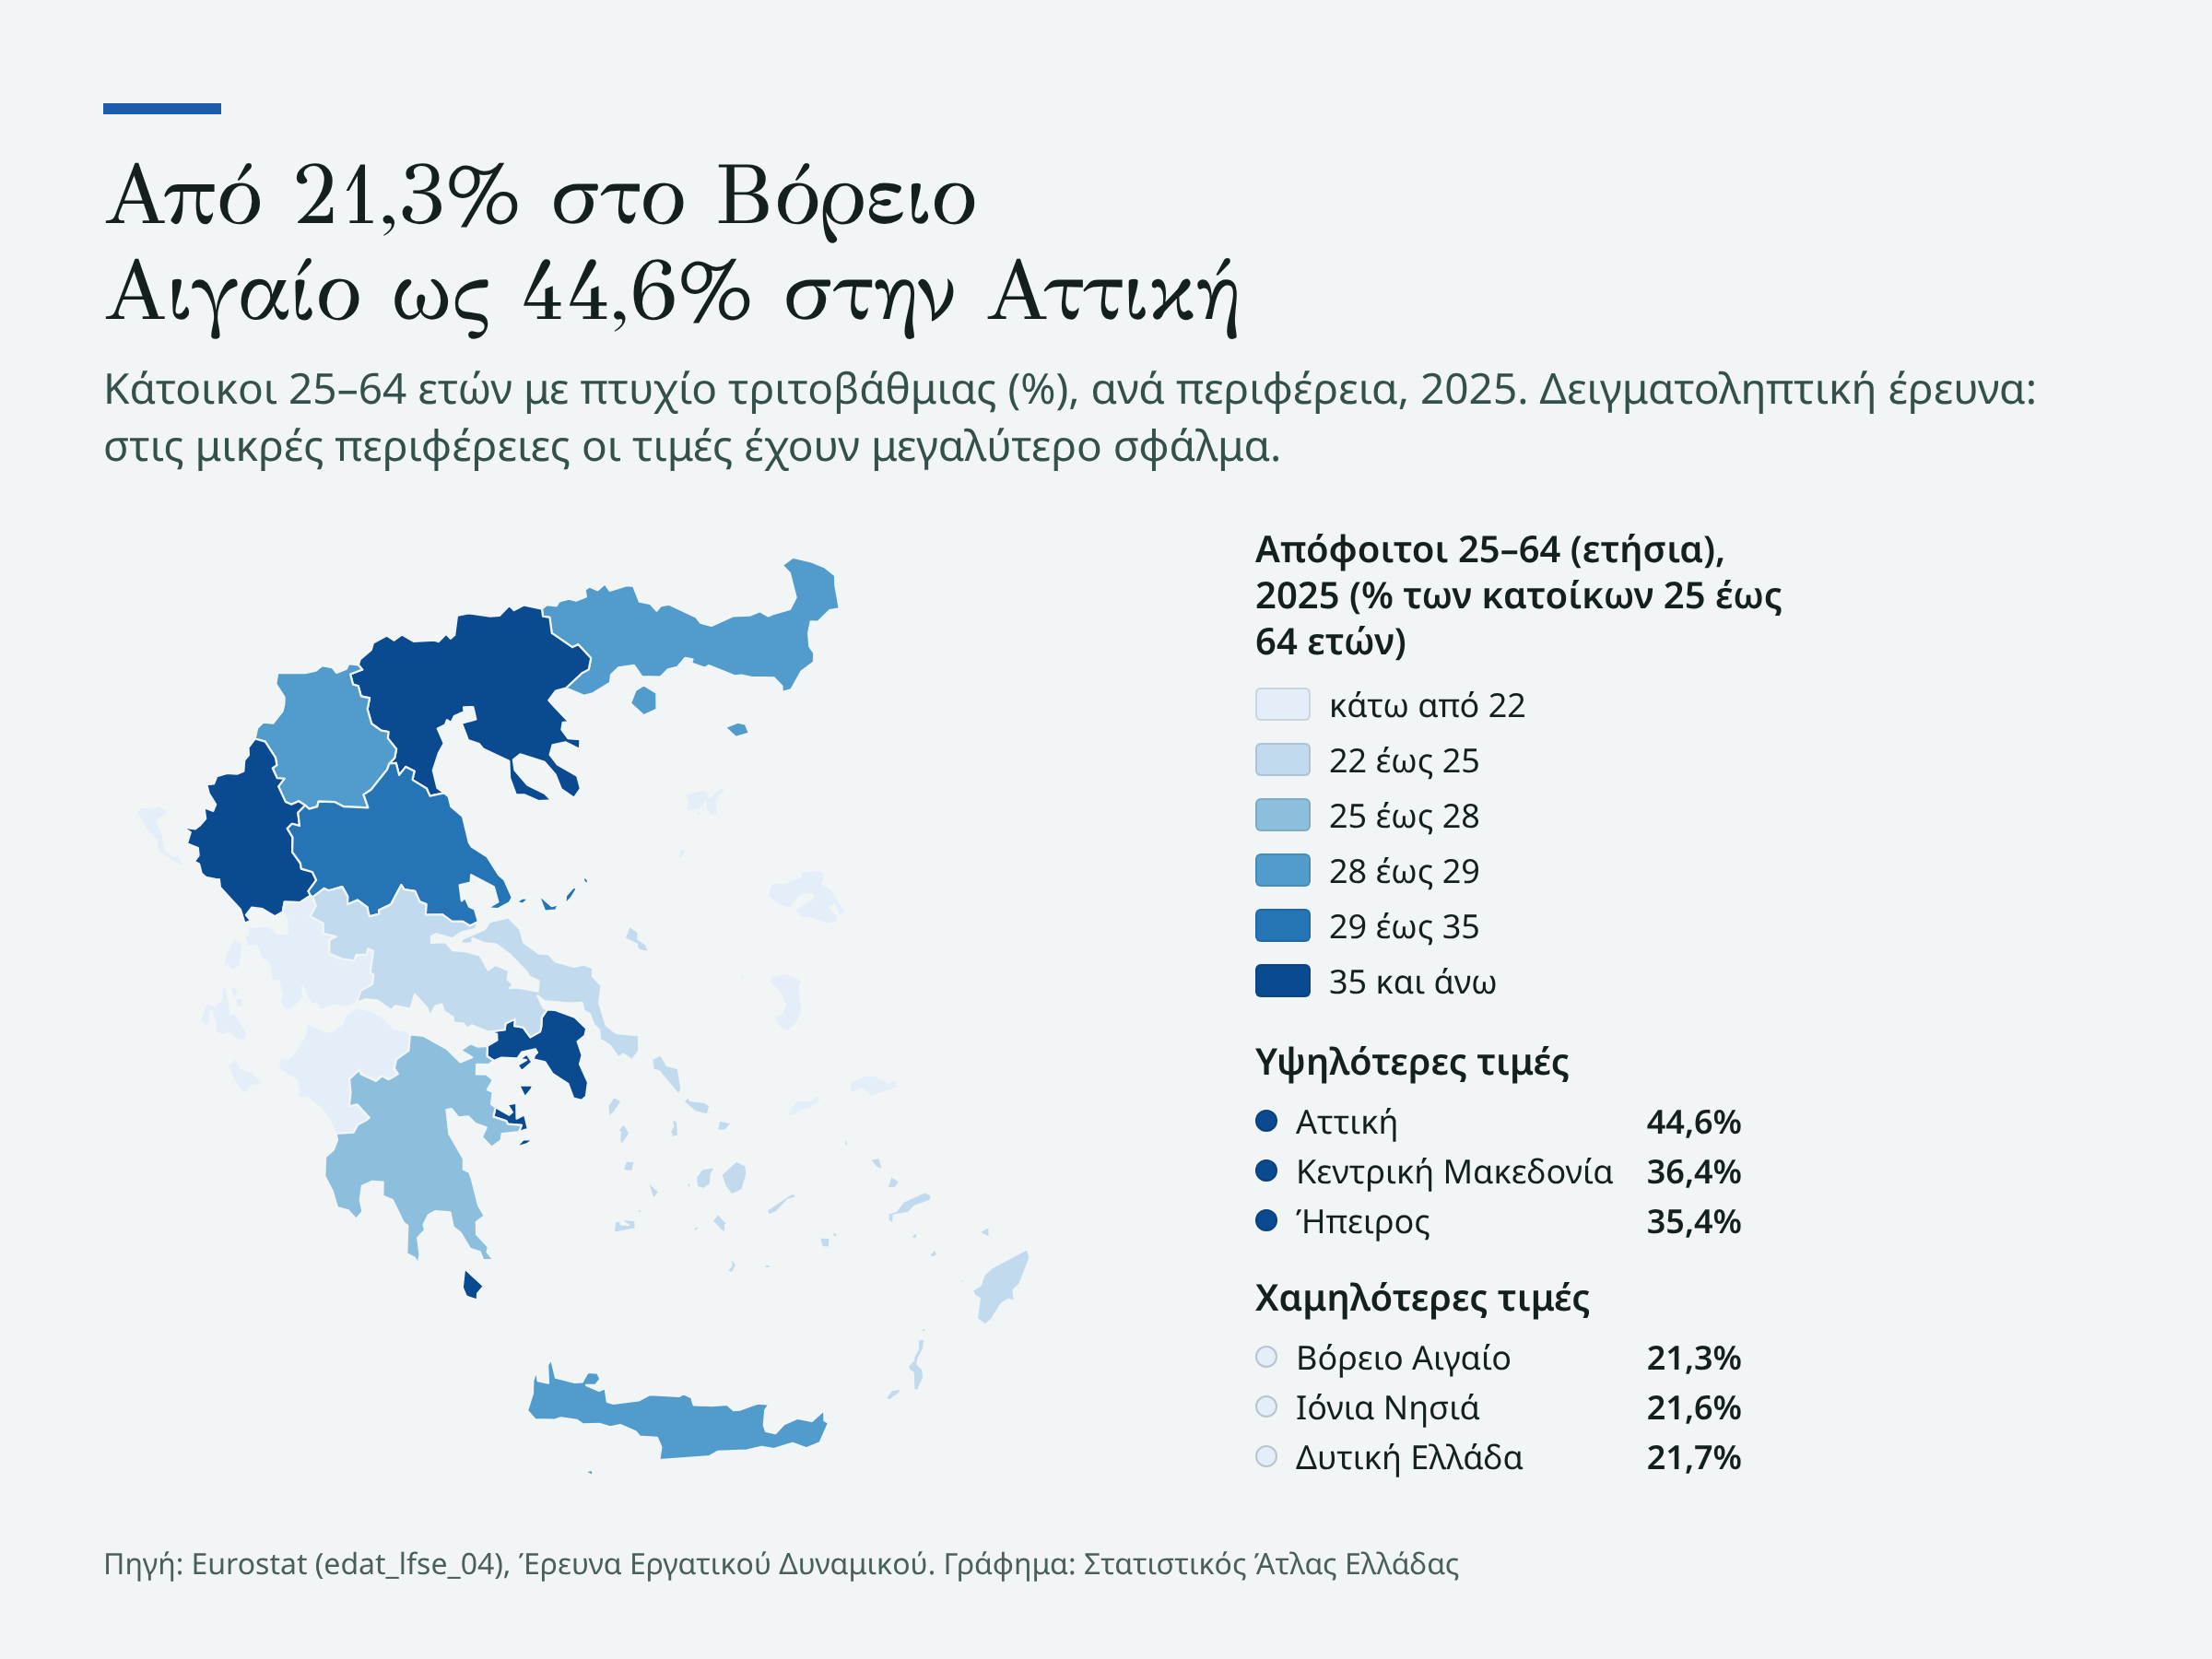
Attica had the highest share of graduates aged 25–64 in 2025, 44.6%. Second was Central Macedonia with 36.4%. Only 4 of the 13 regions had at least 30%. The lowest share was recorded in the North Aegean, 21.3%. The Ionian Islands had 21.6%. Western Greece had 21.7%, so the three lowest regions were less than half a point apart.
Regional values need caution, because the Labour Force Survey is sample-based. For the 2024 «unemployed as a share of the population» indicator, ELSTAT gives a coefficient of variation of 15.51 in the North Aegean and 6.98 in Attica. It is a different indicator from the same survey, but it suggests that uncertainty in small regions is much greater and that the order between close values may not be stable.
What those who already have a degree find
The graduate share measures how many people hold a degree, not what they do with it. For the latter there are other indicators from the same survey.
In 2025 unemployment among graduates aged 25–64 was 6.3% in Greece and 3.6% in the EU-27, the highest among the 27 member states. Their employment rate was 82.7% against 88.1% in the EU, the lowest in the EU-27. Of employed graduates aged 20–64, 31.4% held a job that does not require a tertiary degree, against 21.4% in the EU, the second-highest share after Spain. Of young people aged 15–29 with a degree, 19.1% were neither in employment nor in education or training in 2025, against 8.0% in the EU.
These indicators describe the position of graduates in the labour market. They do not by themselves explain why the graduate share stagnated, and they do not show that one causes the other.
The analyses we read place the emphasis differently. In a study for the Athens office of the Friedrich-Ebert-Stiftung, Maria Mexi writes: «The challenge for Greece is not whether young people have adequate skills, but whether the economy creates jobs that make meaningful use of these skills on decent terms». Eurobank analysts, as reported by Naftemporiki, attributed the fact that young graduates in Greece are more often out of work and education than other young people, among other things, to an «oversupply of graduates, combined with limited demand for highly specialised posts». The study by the National Documentation Centre (EKT) on the Greek diaspora, based on the OECD «Talent Abroad» series, describes «a particular combination of high participation in tertiary education and relatively weak labour market outcomes for young graduates». The same study states that more than half of Greeks aged 20–24 are enrolled in higher education.
We did not find an official annual statistic on the emigration of graduates. The EKT study states that 2023 was the first year since the economic crisis of 2009 in which migration inflows of Greeks exceeded outflows. It notes, however, that data on inflows and outflows of Greek citizens do not by themselves give information on educational level. Ta Nea published in July an analysis by «Greece in Figures», according to which Greek graduates aged 20–64 who left for Europe in 2025 were 13,900 more than in 2024. The estimate concerns Europe only. We did not find its methodology published, and it is not an official statistic.
Why different numbers are in circulation
In July Ta Nea wrote that the European average share of graduates «in proportion to the population» is 32.4% and the Greek one 30.2%, with graduate unemployment of 4% and 6.8%, in a text about graduates aged 25–64. The same numbers, labelled «aged 25-64», are given by an analysis from Greekonomics. In the Eurostat tables, 30.2% and 32.4% are the shares of graduates in the 15–64 age group. Graduate unemployment aged 15–64 is 6.8% in Greece and 4.0% in the EU. So the difference lies in the age group and not in the data. With both definitions, Greece has a lower share of graduates than the EU. With both definitions, it also has higher graduate unemployment.
The employment rate of «recent graduates», which Eurostat puts at 62.4% for Greece in 2025, does not concern graduates only. The indicator also includes upper secondary or post-secondary graduates aged 20–34 who finished one to three years earlier. For graduates only, the value was 66.9% in Greece and 86.9% in the EU. The Greek value for 2024 carries a break-in-series flag, so we do not compare 2025 with 2024.
What we do not know
The data do not show why the Greek share stagnated while the EU’s was rising. We did not find a study examining whether the numbers of young graduates, emigration or the age composition of the population play a role, and we do not attribute the difference to any of them.
We also do not know whether the fall among those aged 25–34, from 44.5% in 2024 to 42.8% in 2025, is real or due to the sample. ELSTAT records that since the third quarter of 2024 the survey sample has been gradually renewed. We did not find a published confidence interval for the graduate share, so we cannot say whether changes of one or two points are within the margin of error. For the 25–64 total the picture is not decided by a single year: Greece was above the EU for two years and below it for three, while the EU rose every year.
How we measured it
The indicator is the share of residents aged 25–64 with a tertiary education degree (ISCED levels 5–8), from the Labour Force Survey conducted by ELSTAT and published by Eurostat. The regional values are from table edat_lfse_04 and the EU comparisons from table edat_lfse_03, which gives the same values for Greece. The series starts in 2021, because that is when ELSTAT changed, among other things, the way data are collected and weighting coefficients are calculated. Eurostat marks 2021 as the start of a new series, so we do not compare with earlier years. The survey covers private households only.
We calculated the country ranking from the Eurostat table for the 27 member states. We describe as «practically stagnant» a series whose total change is smaller than the year-to-year fluctuations, and not the result of a statistical test. In the unemployment indicator, the values for Spain and France carry Eurostat’s flag «d», which means a different definition. The same applies to the employment indicator. It also applies to the over-qualification indicator.
Sources: Eurostat, ELSTAT, Friedrich-Ebert-Stiftung, National Documentation Centre (EKT), OECD.