


Western Greece has the most students per resident and among the lowest shares of residents with a degree. Attica is the reverse. What the data show and what they do not.
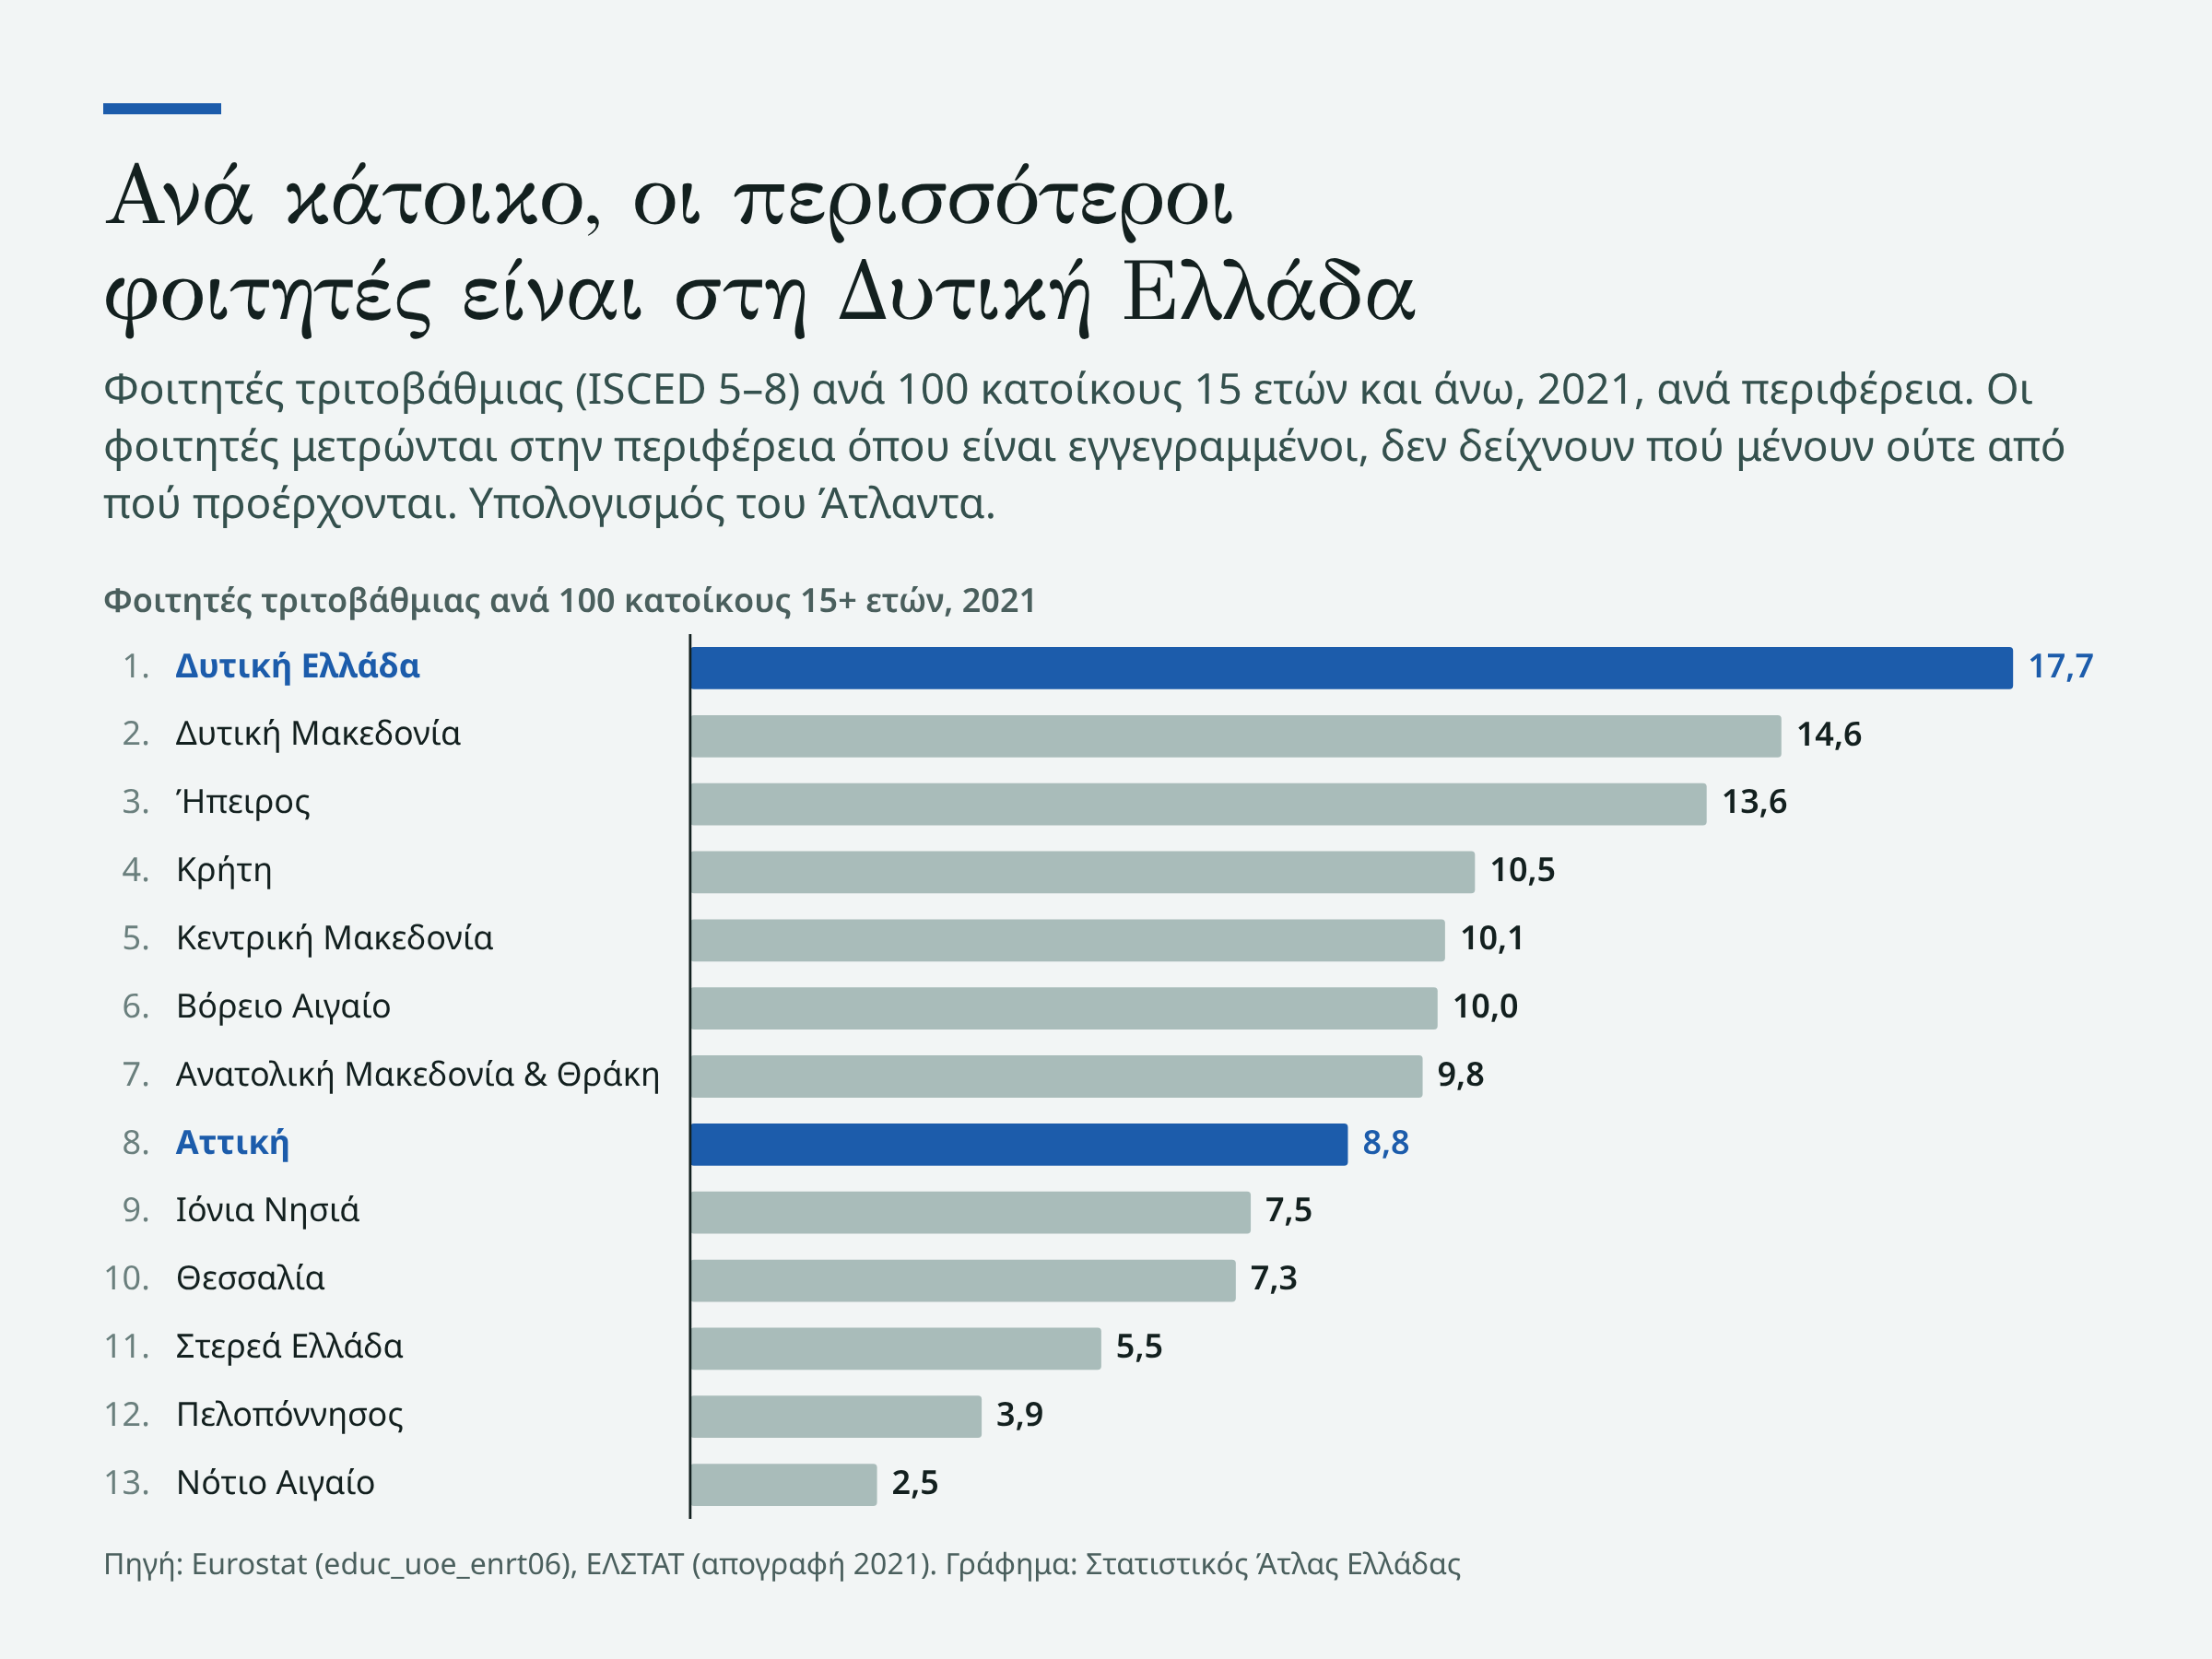
Counting students per resident, Western Greece is first in the country. Counting the share of residents with a degree, it is among the lowest. In 2021, 99,360 of the country’s 843,832 tertiary students studied there, 11.8%. The same region was home to 102,201 of the 2,208,819 residents with a degree, 4.6%, while it has 6.2% of residents aged 15+. As a share of its own residents aged 15+, 18.2% hold a degree: third lowest, within 0.1 point of two other regions. Attica shows the opposite picture: 34.5% of students and 46.0% of residents with a degree (1,016,244 people), while it has 36.5% of residents aged 15+.
Where students are enrolled
Eurostat counts students by region of enrolment. In 2021 Attica and Central Macedonia together had 53.0% of students, and 53.3% in 2024 (of 885,486 in total). The same two regions hold 53.6% of residents aged 15 and over: students are spread roughly like the population.
Per 100 residents aged 15+, the pattern changes. Western Greece has 17.7 students, Western Macedonia 14.6 and Epirus 13.6. Attica has 8.8 and ranks eighth of 13 regions, while South Aegean is last with 2.5. The calculation is ours: students (all ages) divided by census residents aged 15+ of the same year.
Where degree holders live
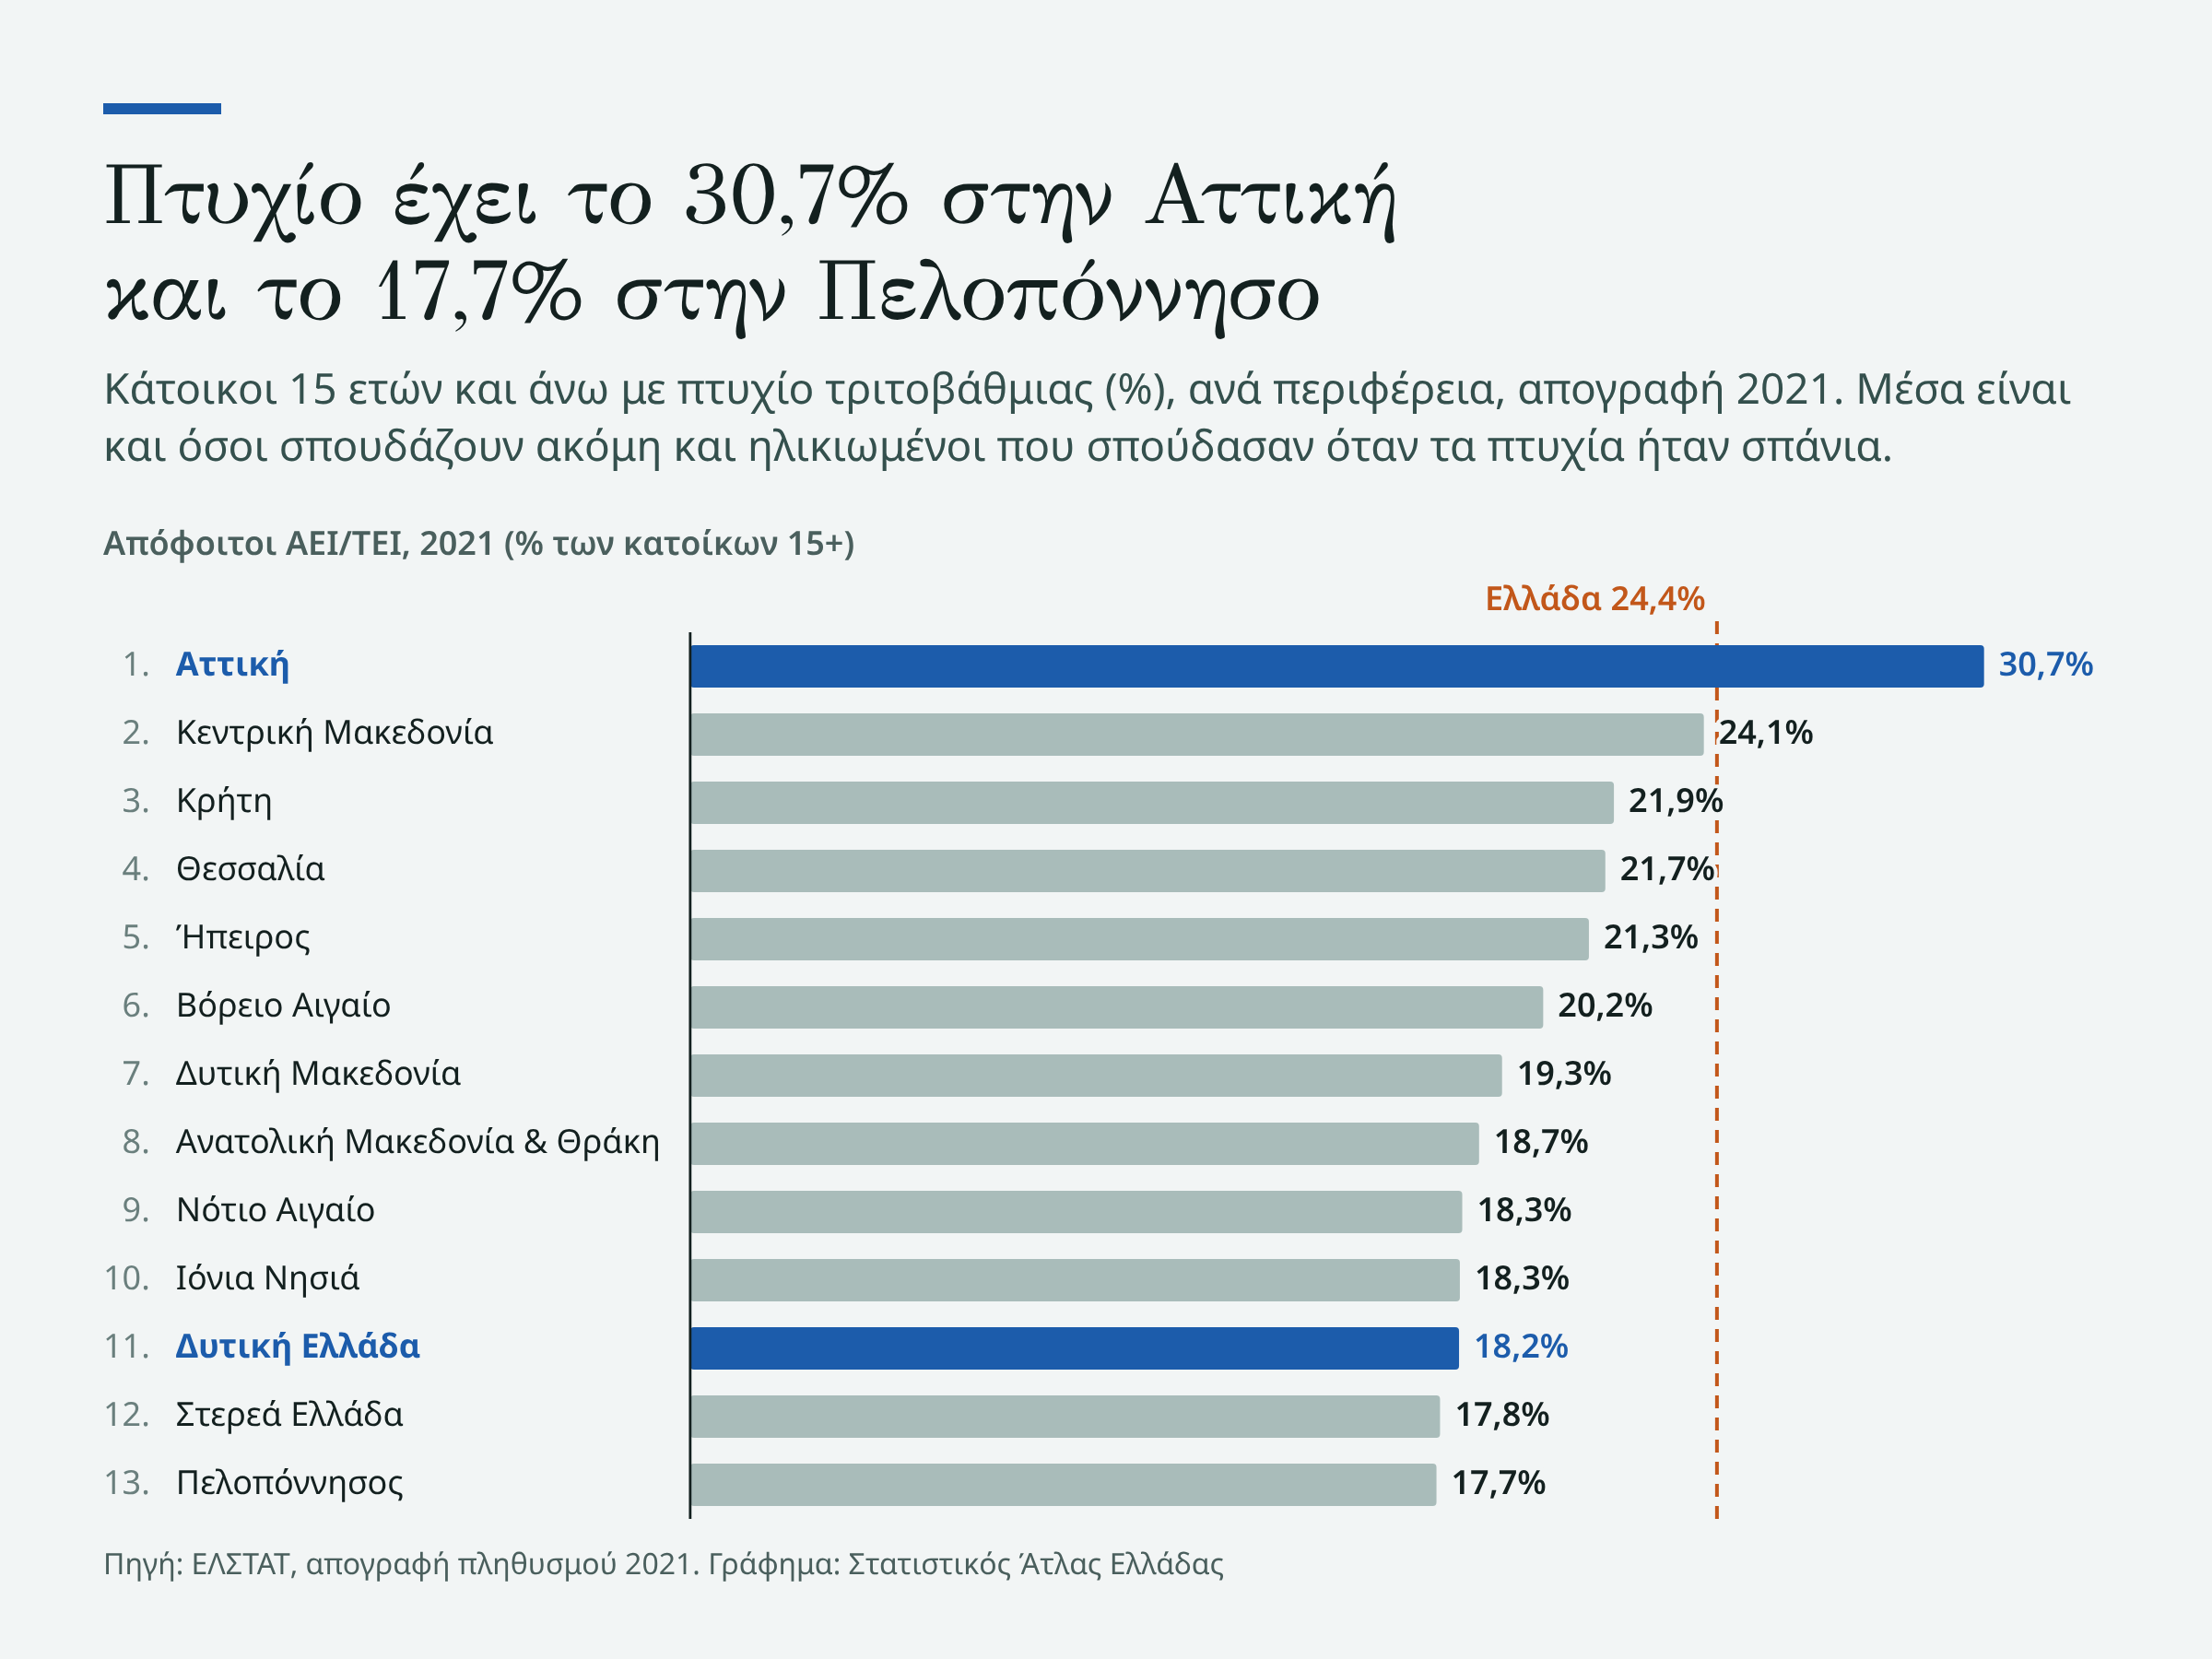
In the 2021 census, 30.7% of Attica’s residents aged 15+ held a degree, against 24.4% nationally. In the Peloponnese it was 17.7%. In each of the 13 regions the share rose by 3.8 to 5.1 points since 2011, and the Attica–Peloponnese gap stayed almost the same: 12.1 points in 2011, 13.0 in 2021. The 2011–2021 comparison does not cross a census method change; 2001 is not fully comparable and we do not use it.
The Labour Force Survey points the same way for 2025, on a different age base (25–64). Attica has 44.6%, above the EU-27 average (36.9%), and none of the other 12 regions reaches it. Central Macedonia is highest among them at 36.4%, and North Aegean lowest at 21.3%. Western Greece is again among the three lowest, at 21.7%. The two sources cannot be compared in level, because they count different populations. The survey is sample-based and values for small regions swing from year to year, so the half-point gap (Central Macedonia–EU) is not enough for a conclusion.
What we cannot say
The two figures measure different things. Students are those studying now, of all ages, by region of enrolment; «students per 100 residents» is an enrolment ratio, not the share of the region’s residents who study. Residents with a degree are everyone holding one, from all generations, by region of residence. We do not know where students came from, where they will live afterwards, or where the census records someone studying away from home. Neither source follows individuals, so neither shows that graduates «leave» or «arrive» anywhere, or why.
There is another side. A region with many students per resident may simply have large universities for its small population, and a region with many degrees may owe them to older generations. The census also counts young people still studying and older people who studied when degrees were rare, which is why its share is lower than the Labour Force Survey’s.
Early in school, not by region
For schooling only one figure stands: in 2025 young people aged 18–24 who had finished at most lower secondary school and were not studying were 3.0% in Greece and 9.1% in the EU-27. By region, Eurostat gives no 2025 value for most, and where it does (4 of 5) it flags low reliability. The only one without such a flag is Attica, at 2.4%. We therefore do not compare regions here.
What we take away. The map of students and the map of residents with a degree do not coincide: Attica concentrates degrees more than students, and Western Greece the reverse. We do not know whether this reflects movement, generations or how people are recorded.
How we measured it
Students (ISCED levels 5–8, both sexes) come from Eurostat table educ_uoe_enrt06, by NUTS2 region. Residents with a degree and residents aged 15+ come from the 2011 and 2021 censuses of ELSTAT, with the same levels (university, polytechnic, TEI, higher schools, master’s, doctorate). The percentage-point changes and students per 100 residents are our calculations. The 25–64 data and early leavers (18–24) come from tables edat_lfse_04 and edat_lfse_16, that is, the Labour Force Survey, which covers private households only. Eurostat flags a break in series in 2021 and 2024 for the Greek early-leaver value, so we show only 2025.
Sources
Eurostat, tables educ_uoe_enrt06, edat_lfse_04, edat_lfse_16.
ELSTAT, population censuses 2011 and 2021.

