


The same areas age, lose population and have low GDP. Empty homes do not follow the same pattern, and unemployment is visible only by region.
Drama is in the worst third of the country on all four indicators (ageing, natural change, population loss, GDP per head): 26.7% of its residents were aged 65 and over in 2021, its population shrank by 11.8% in ten years, and GDP per head was 46.5% of the EU average in 2023. It is not alone: together with Evrytania, Serres, Kastoria and Evros it is one of five of the 52 areas that fall in the worst third on all four indicators at once. The question of this article is whether that is the rule, or a neat story that fits five names.
The first Greece: the same names, again and again
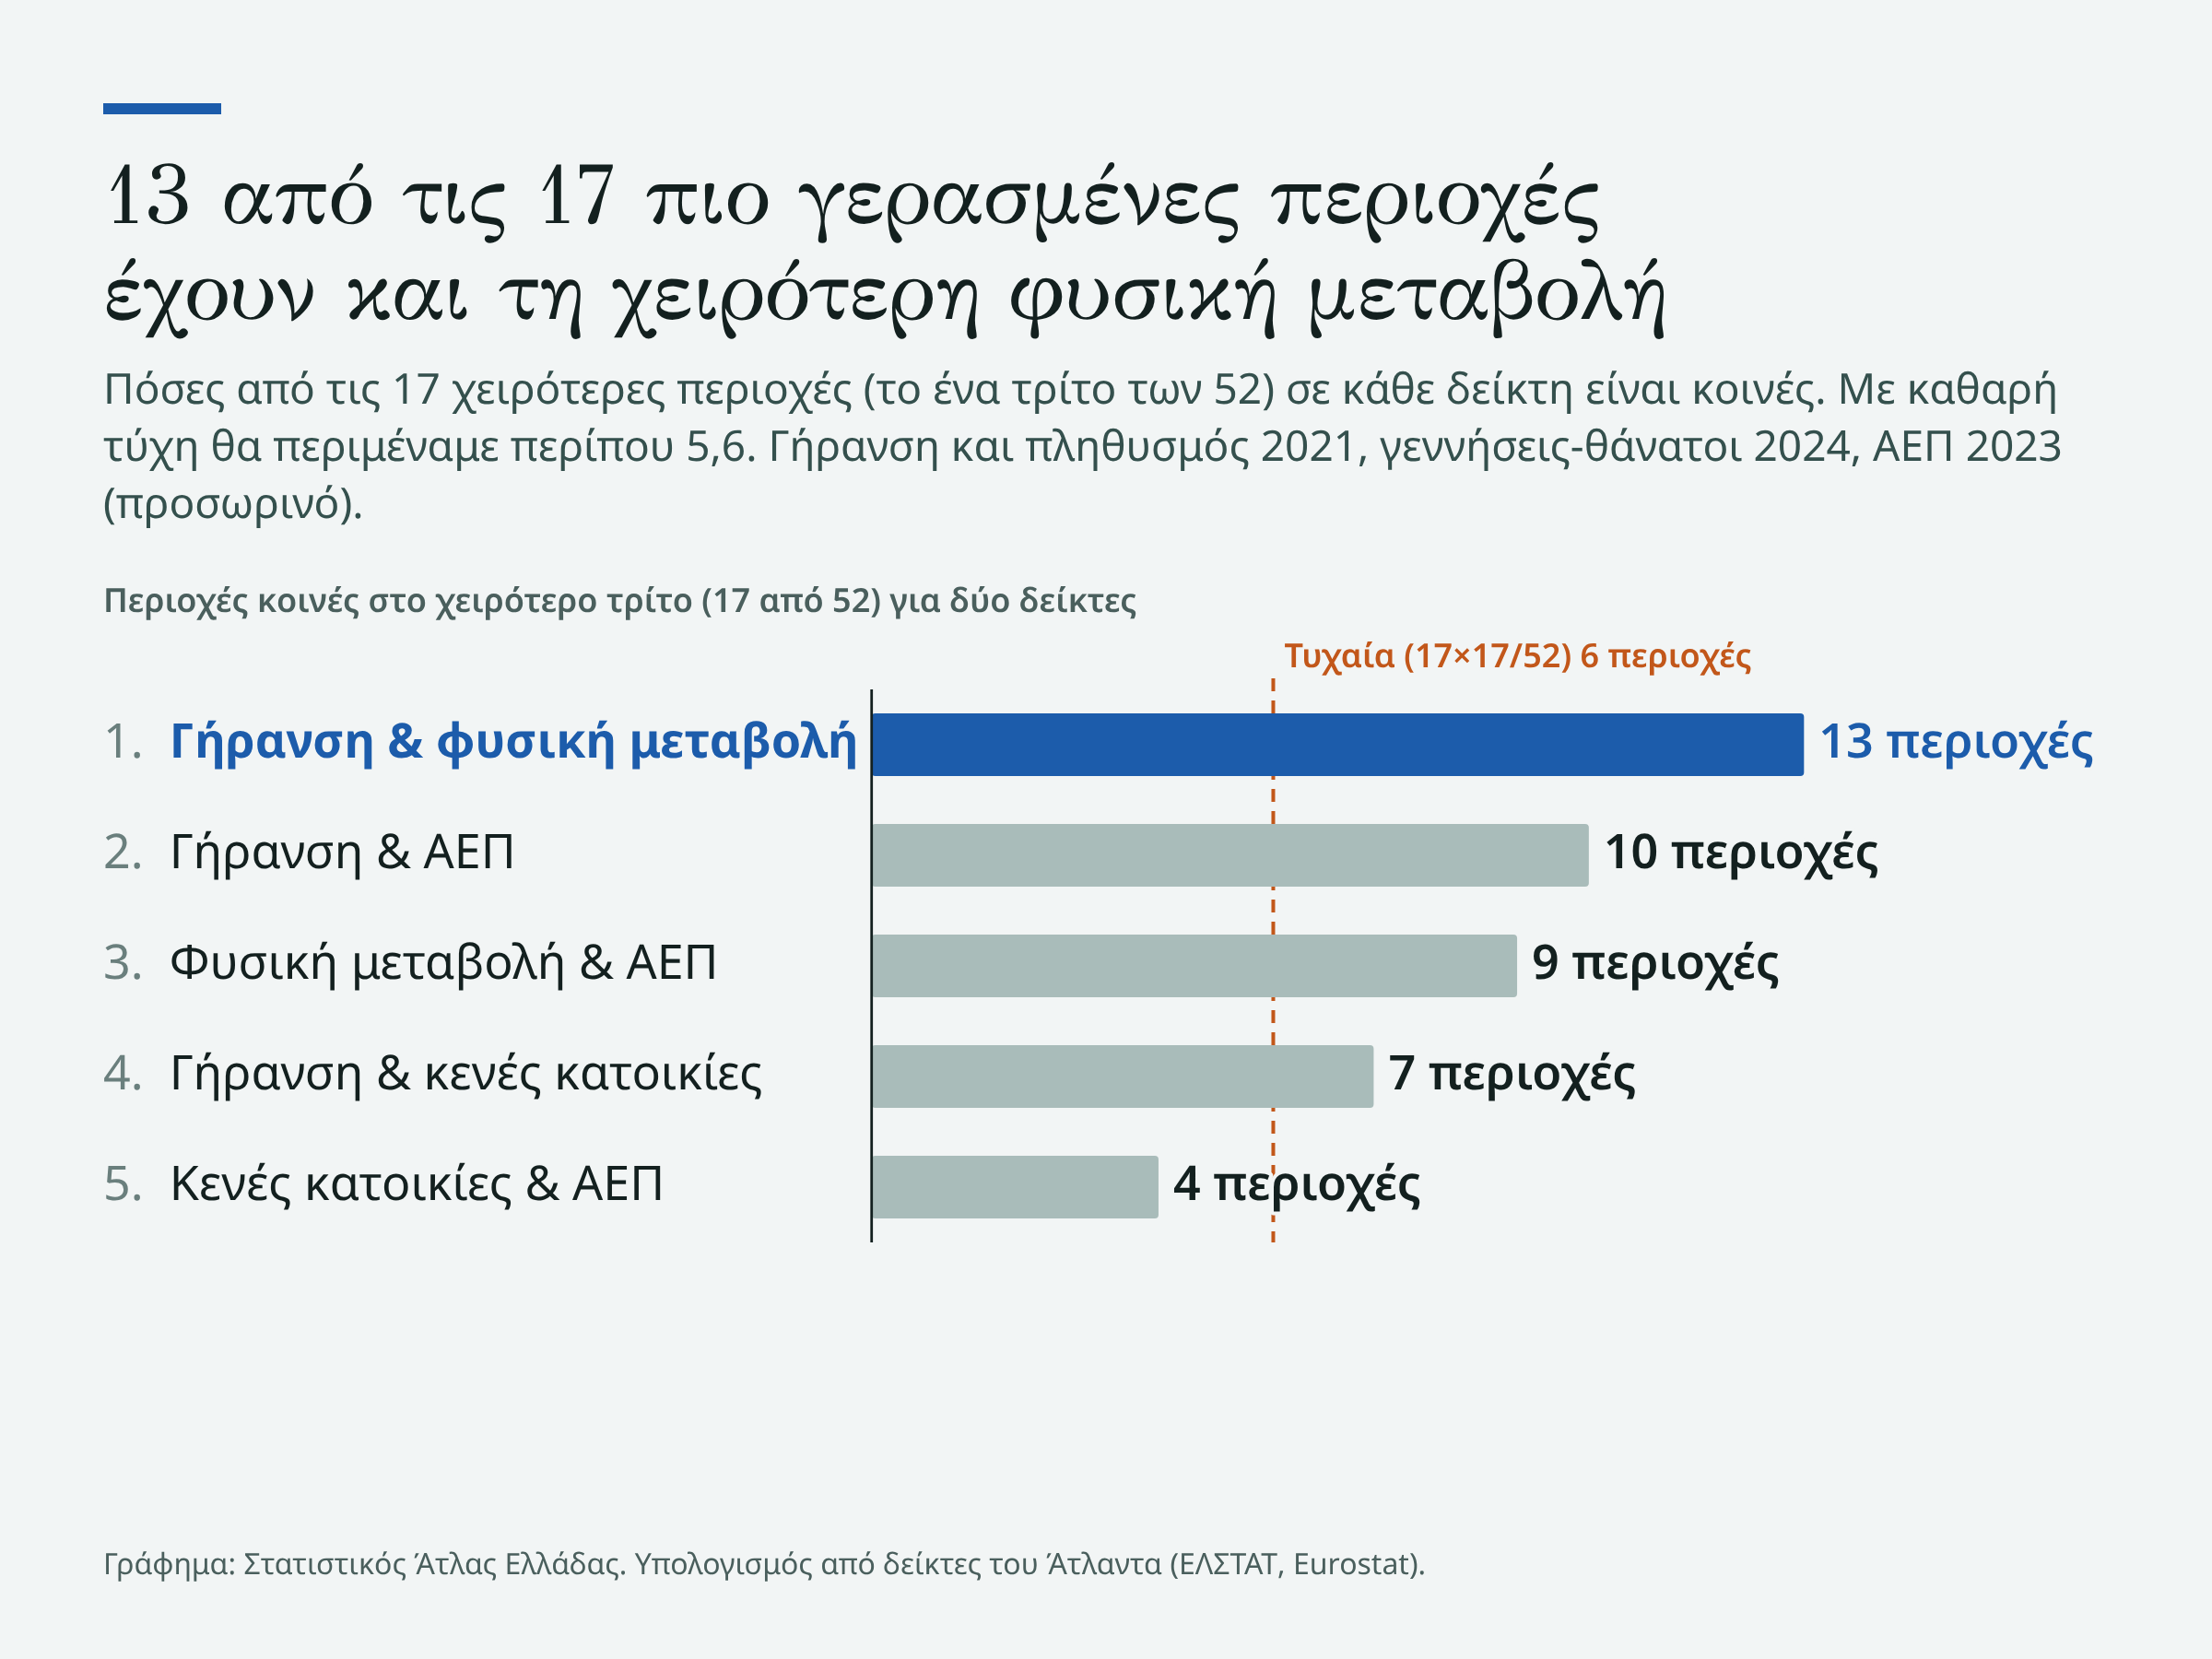
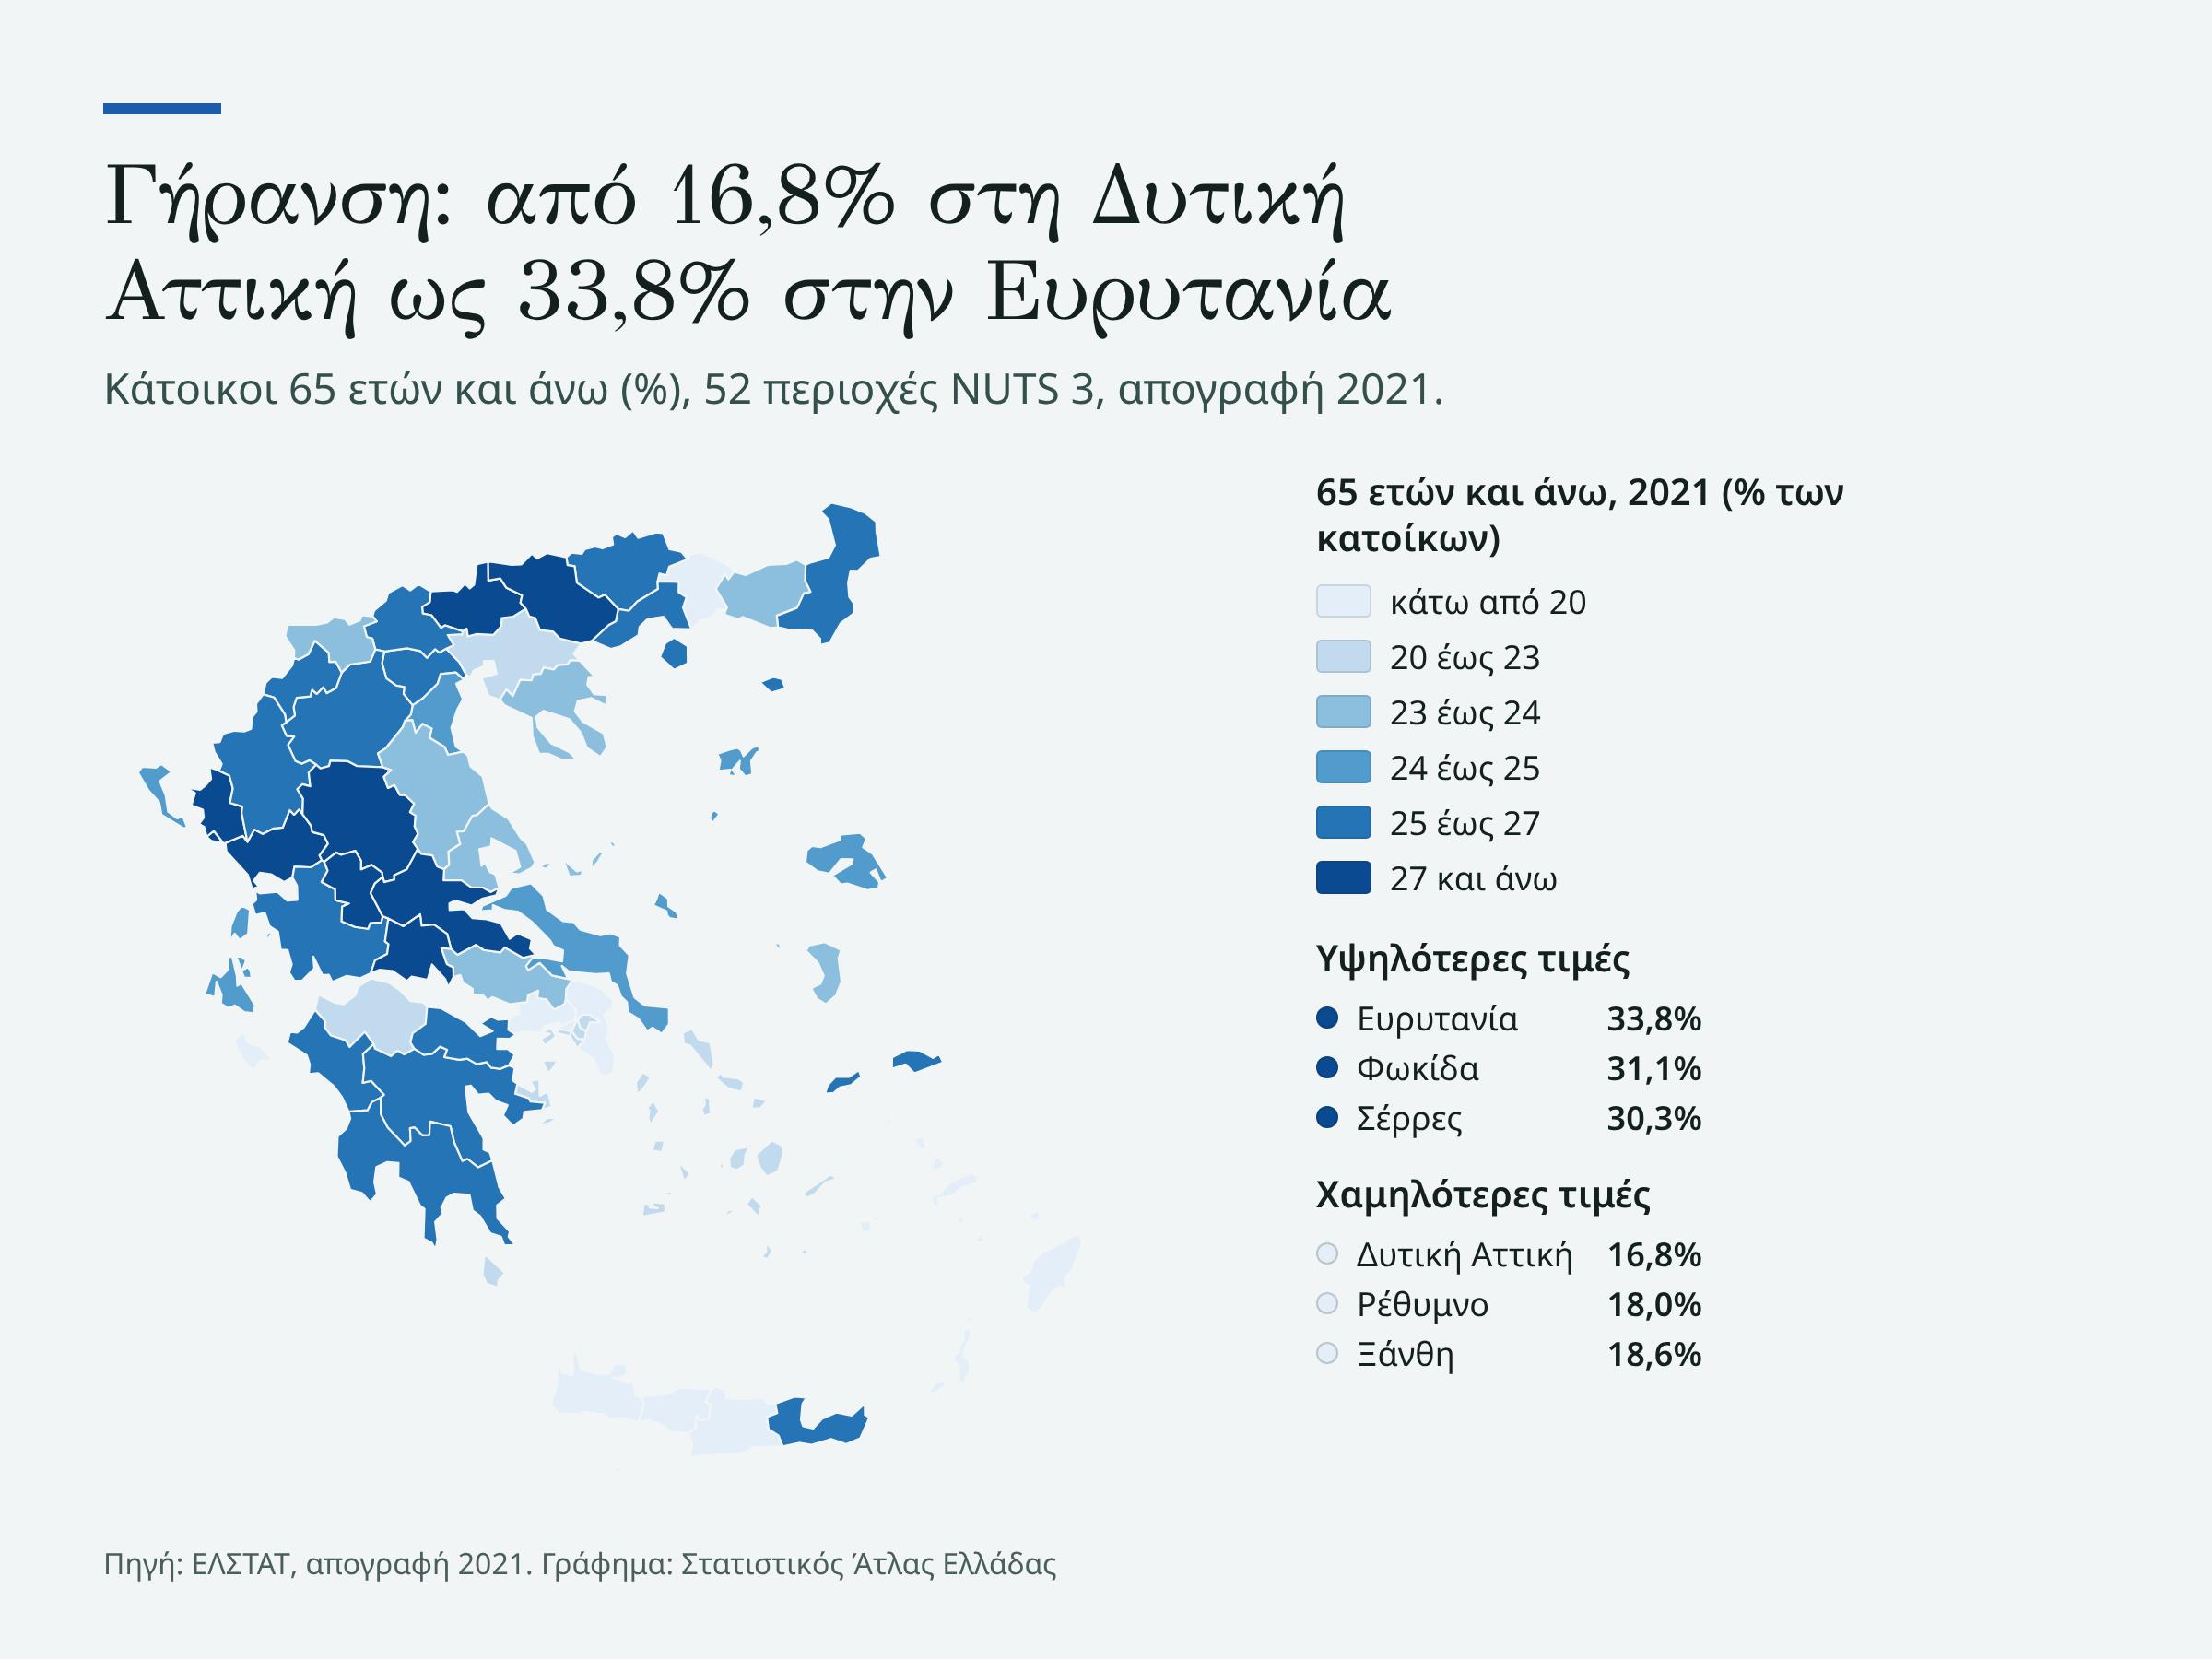
We start with ageing. In Evrytania 33.8% of residents were aged 65 and over in 2021, in West Attica 16.8%. If we put side by side the 17 oldest areas and the 17 with the worst natural change in 2024, 13 are the same. By pure chance we would expect about six. The two rankings agree very strongly: the Spearman coefficient is −0.86, where −1 would mean the oldest are always the ones with the most negative balance. This is no surprise, since an aged population naturally has fewer births and more deaths. In 2024 only Rethymno had more births than deaths, and by just five. In all other 51 areas deaths were higher. So the issue is not who loses, but how much. In Drama and Serres the population shrank by 11.8% and 14.2% in ten years, when in the country it shrank by 3.1%. The same pattern holds for GDP per head, only weaker. Ten of the 17 oldest areas are also among the 17 with the lowest GDP, the Central Sector of Athens reaches 126.0% of the EU average and Xanthi 38.2%. In between, the country stands at 69.5%.
The exceptions that spoil the clean picture
West Attica is the youngest area in the country, its natural change is almost zero (−0.2 per 1,000 residents), with GDP per head at 102.6% of the EU average. The Cyclades have GDP at 91.4% and a 65+ share of only 20.9%. The Central Sector of Athens has the highest GDP of all and, in 2024, the largest loss of births over deaths: −5,570. GDP is measured where it is produced, not where the people who work live, so an area with many jobs looks rich even if its residents are not.
Empty homes: a different map
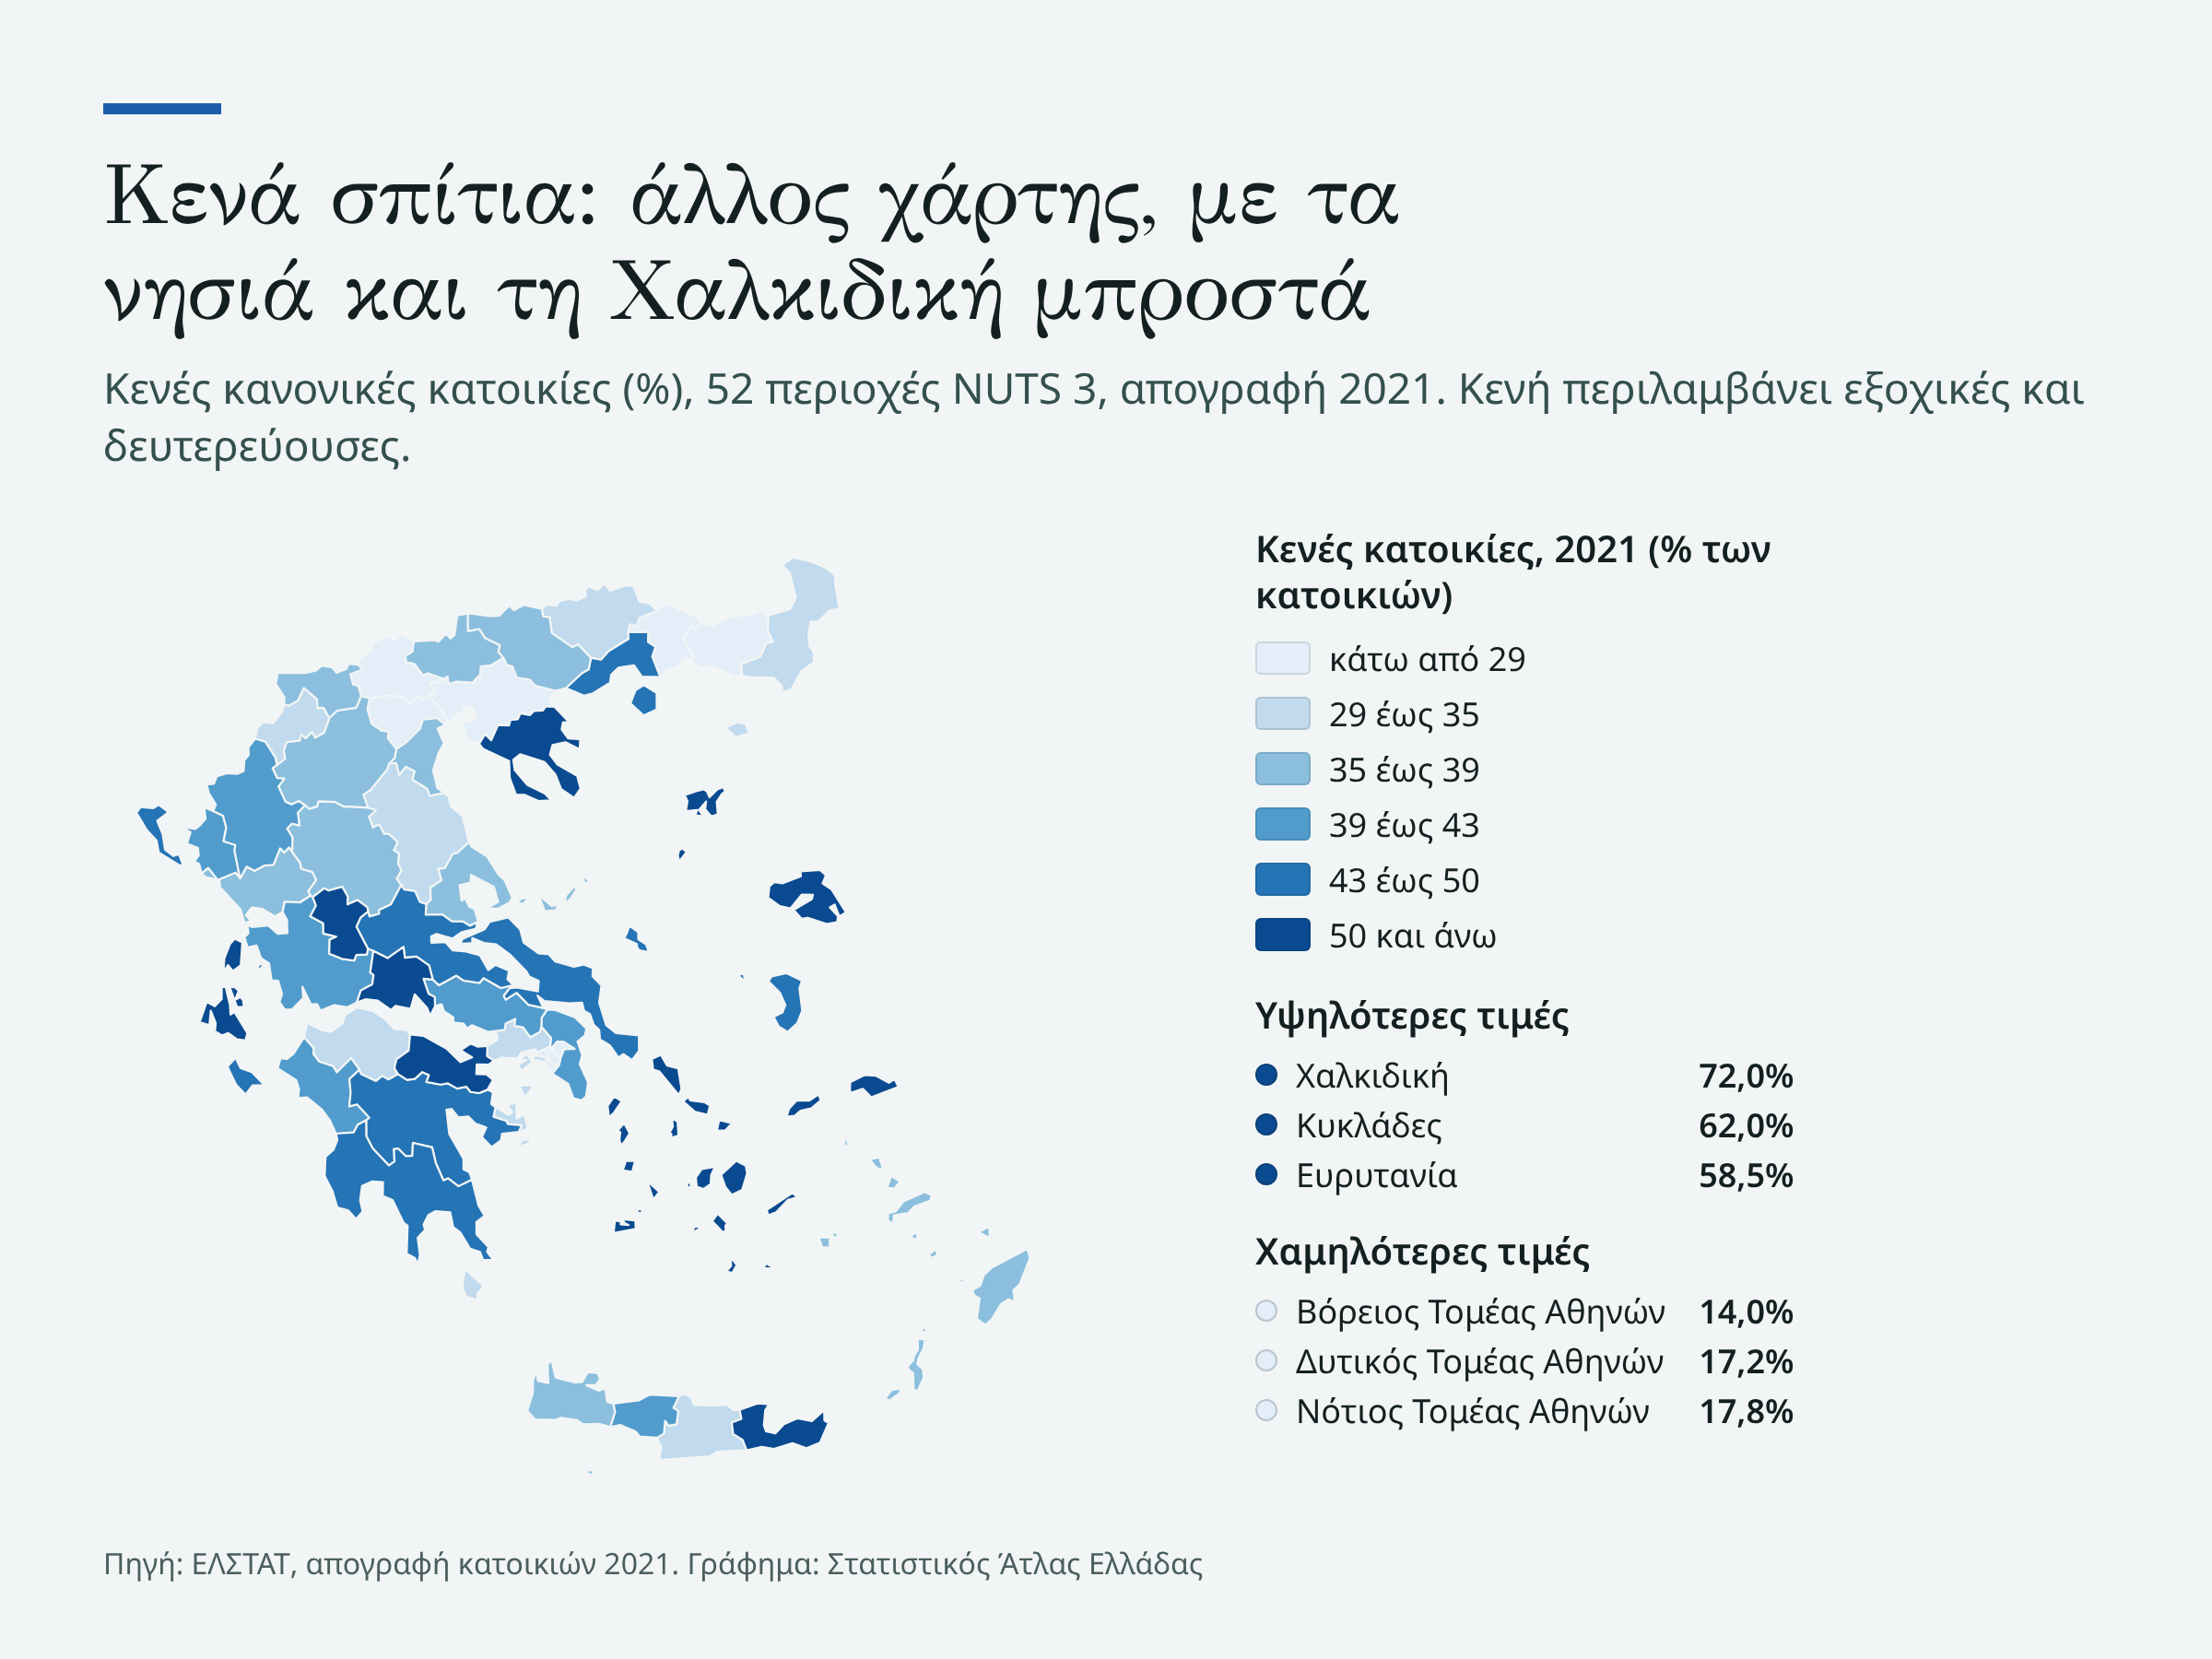
If the story were «areas that are emptying out», empty homes would follow. They do not. In Chalkidiki 72.0% of regular dwellings were empty in 2021 and in the Cyclades 62.0%, while the 65+ share there is 23.3% and 20.9%, close to or below the country's 22.8%. Only 7 of the 17 areas with the most empty homes are also among the oldest, and 4 are among the 17 with the lowest GDP. Eight are in no other worst third, among them Corfu, Zakynthos and Kefalonia. An exception is Evrytania, with 58.5% empty and the highest ageing share. In the census, empty also means holiday or secondary homes: the islands mostly show homes without a permanent resident, not villages that vanished.
Unemployment: only the wide-angle view
Unemployment is published only by region, not by area, and comes from a sample survey. In 2025 it was 5.1% in Crete and 15.3% in Western Macedonia, with 8.9% in the country. Four of the five core areas, Drama, Serres, Kastoria and Evros, are in a region with unemployment above the national rate. Evrytania, at 8.5%, is below it. Trikala and Karditsa, with 28.7% aged 65+, are in Thessaly with unemployment of 6.3%. Across the 13 regions the unemployment ranking correlates moderately with natural change (−0.58) and less with GDP (−0.37) and ageing (0.30). With 13 points and sample-based rates, this is a hint, not a finding.
Two Greeces, or one slope
The answer is somewhere in between. Ageing, natural change and population loss go together, and the three largely measure the same thing. GDP follows more loosely, while unemployment is visible only by region and gives hints, not a firm picture. Empty homes follow another road. We do not know why. Correlations show where phenomena coincide, not what causes what, and small areas (Evrytania has 17,428 residents) swing a lot with a few people. We keep something more modest than «two Greeces»: a country with a core of five areas that lose everything together, and around it many that lose something, but not the same thing.
How we measured it
We used the Atlas’s 52 NUTS 3 areas (some merge neighbouring units, such as Arta and Preveza). Indicators: share of residents aged 65+ and population change from ELSTAT’s 2011 and 2021 censuses, natural change in 2024 (births minus deaths by place of residence) per 1,000 residents using Eurostat’s 1 January 2024 population, GDP per head in 2023 in purchasing power standards (provisional, as a % of the EU average, with population revised to the 2021 census), and empty dwellings in 2021. Worst third means the 17 worst of the 52. The coefficients are Spearman rank correlations and correlation does not prove causation. GDP is measured by place of work, unemployment (ages 15–74) is published only by region and is sample-based, and the Atlas has no unemployment by area. Rates for small areas swing widely with a few people. Chalkidiki includes Mount Athos.

