


In 2025 owners are two in three of those who spend more than 40% of their income on housing. In the EU, half are tenants.
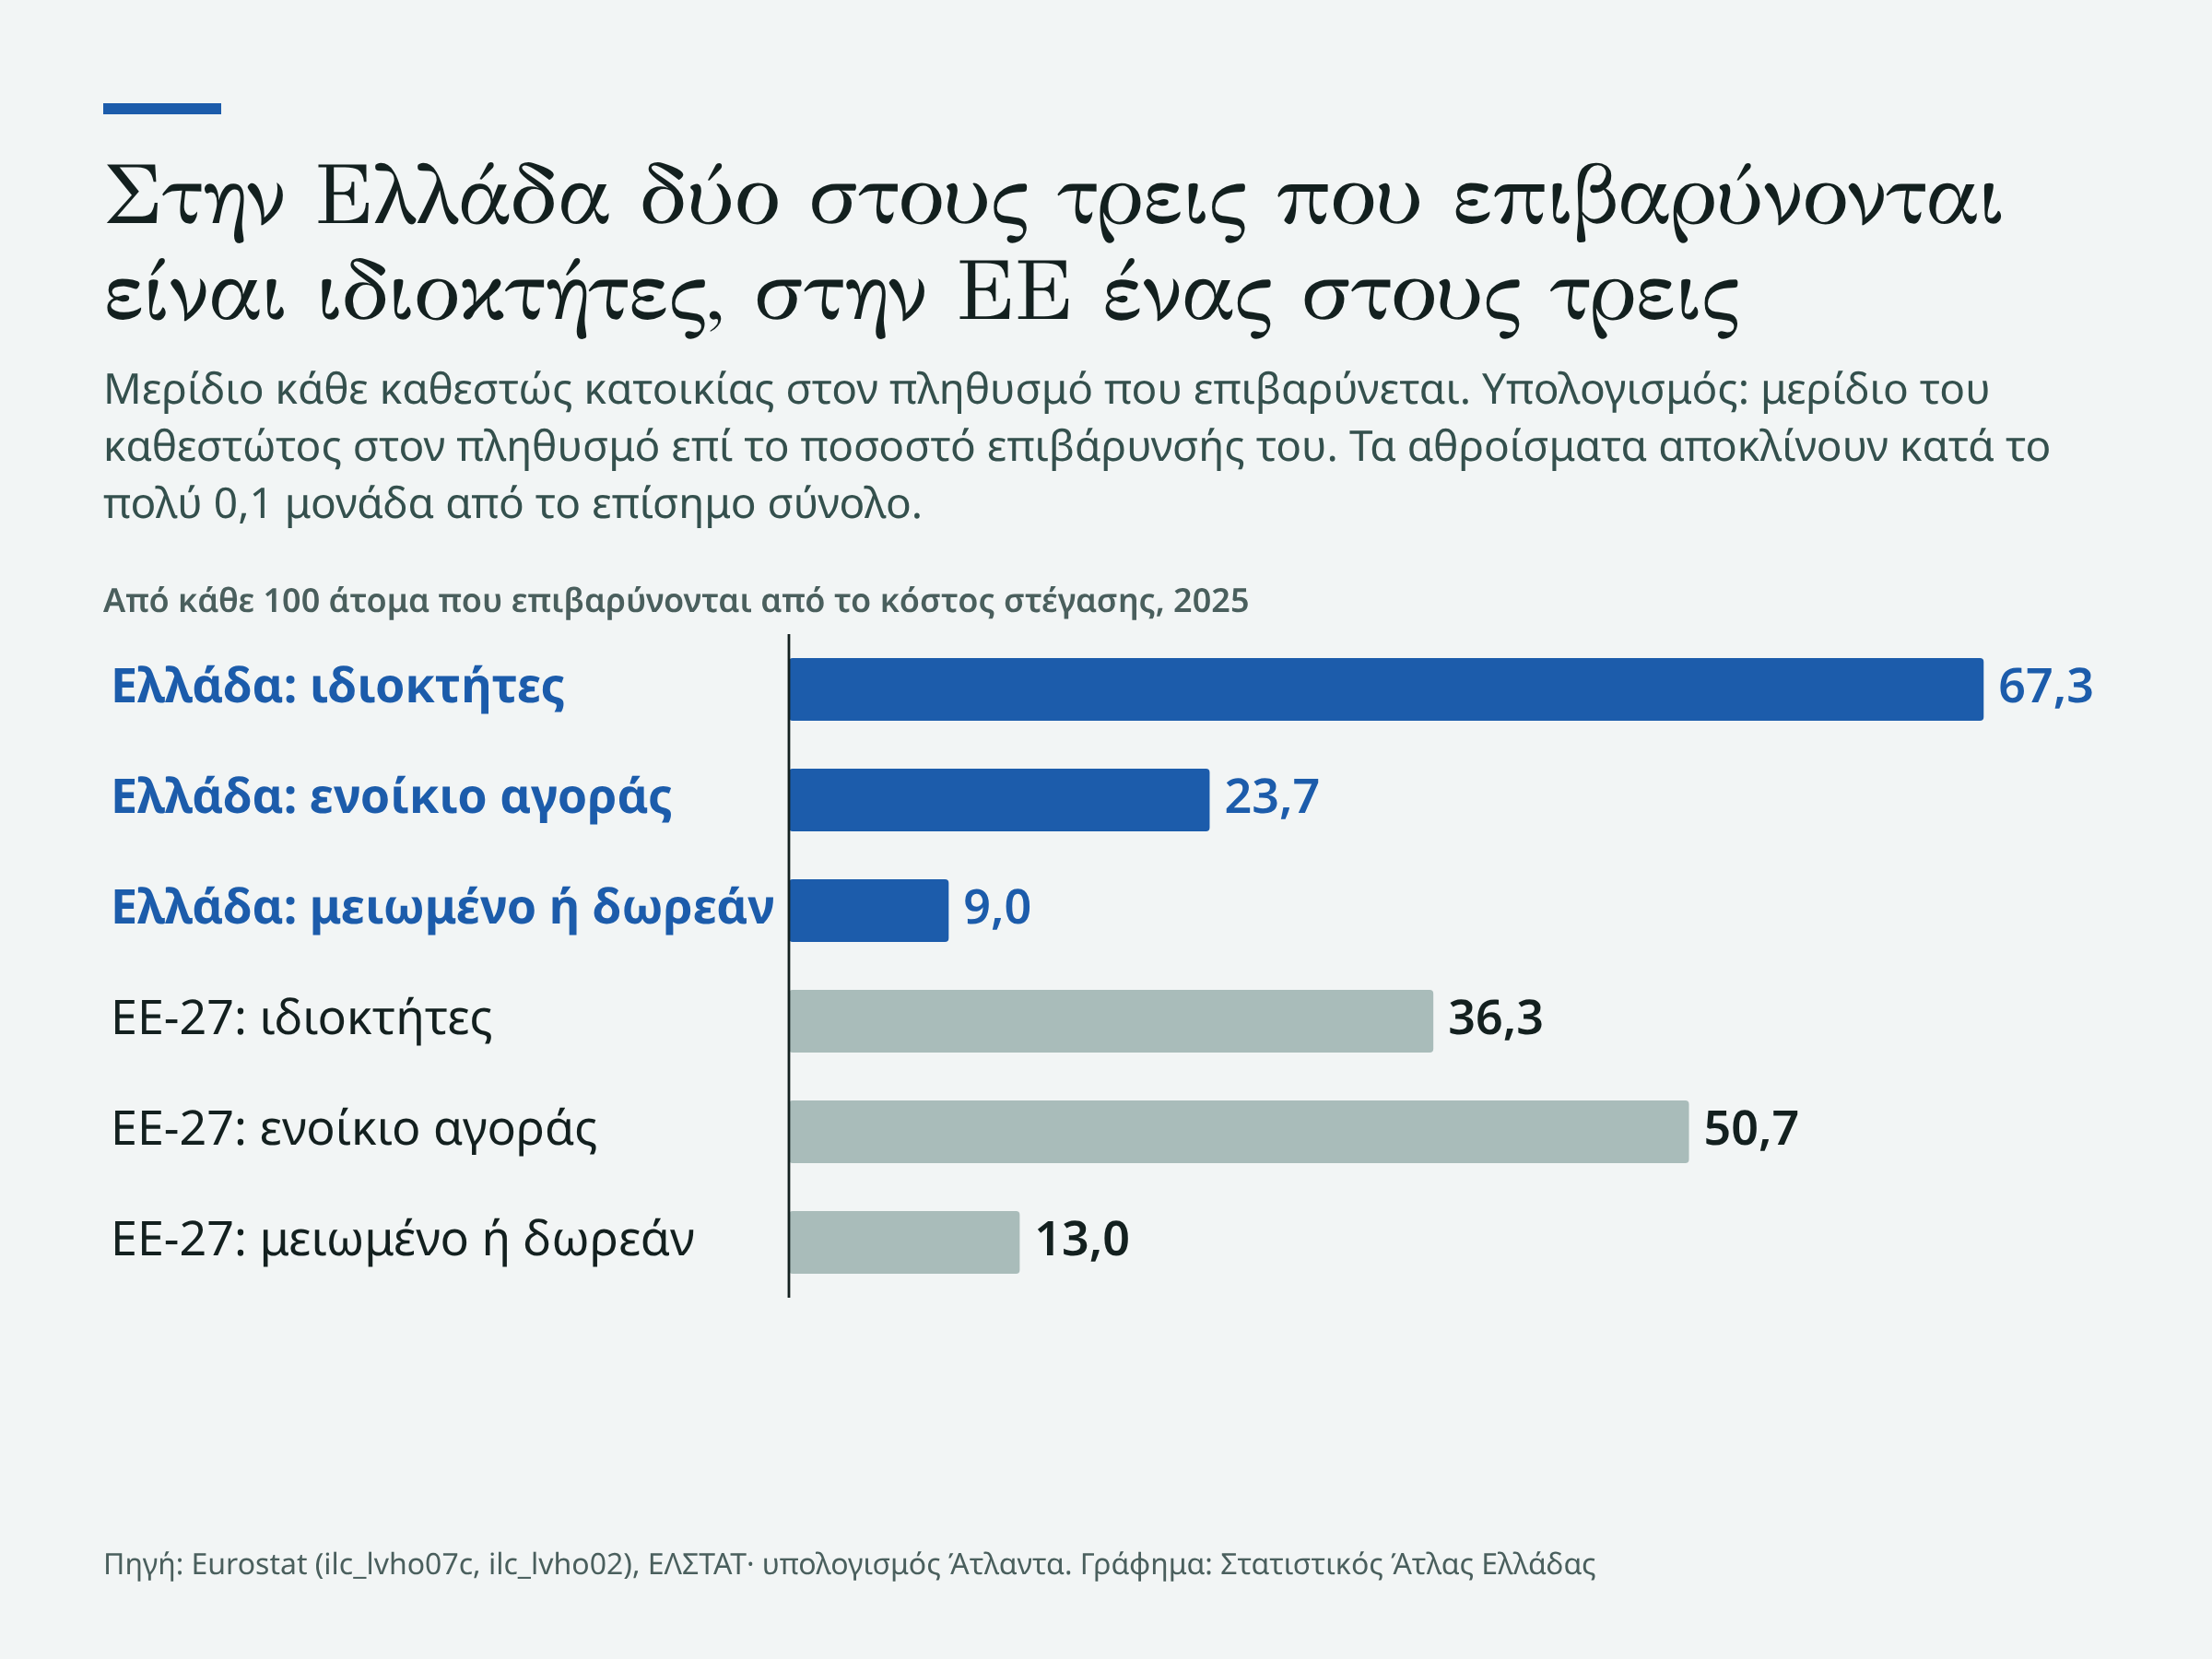
When we talk about housing costs, we picture the tenant. The data show something else: in 2025, of every 100 people with a housing cost burden, 67 live in a home they own. In the EU the figure is 36, while 51 are tenants at market price. The estimate is ours, from burden rates and the population split by tenure status.
A country of owners, mostly without a mortgage
69.4% of the population lives in a home it owns, almost the same as in the EU (68.5%). In 2010 it was 77.2%. The difference is the loan: 60.4% live without an outstanding mortgage (EU 43.7%) and 8.9% with one (EU 24.8%). Tenants at market price are 24.1% (EU 20.8%).
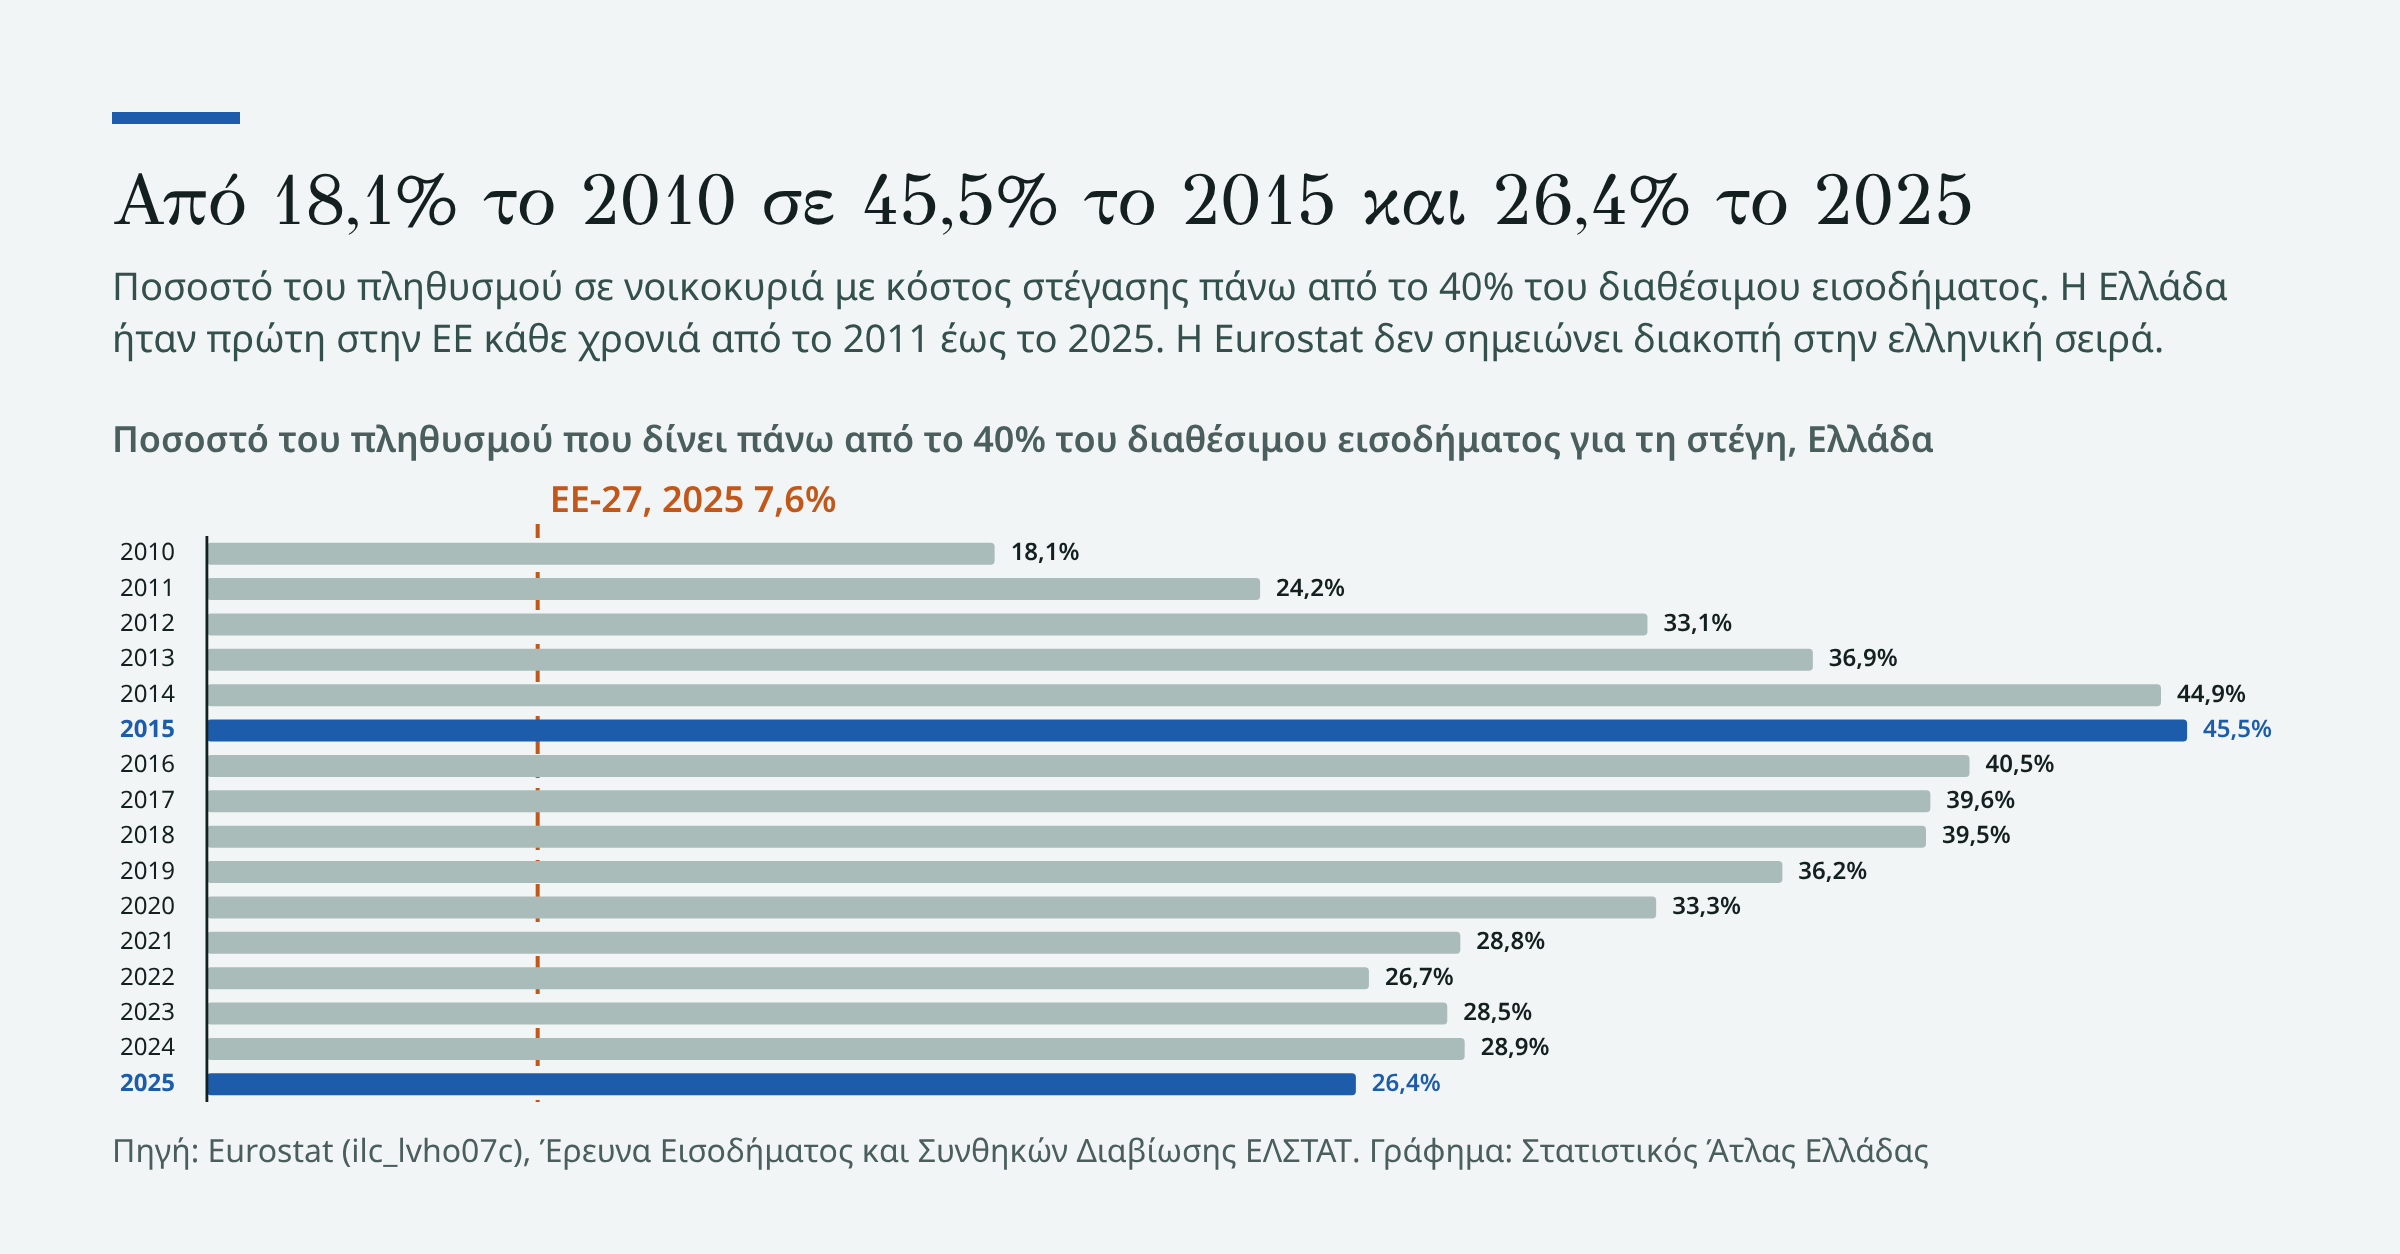
This is the other side of the 26.4%. For Eurostat, housing costs are not only rent or the mortgage payment but also electricity, water, heating, taxes, insurance and maintenance, net of housing allowances. ELSTAT defines the burden as costs above 40% of disposable income. The 2025 survey measures 2024 income.
Tenants at market price: the exception
In 2025 Greece has the highest rate in the EU in three of the four groups: owners without a mortgage (26.2% against 3.7%), owners with a mortgage (22.2% against 4.6%) and tenants at reduced or free rent (36.2% against 9.2%). Tenants at market price are the exception: 26.0% against 18.5% in the EU, ninth among the 27 member states (tied with Czechia).
Caution: the tenant series are not comparable with earlier years. In the Eurostat data the rate for tenants at market price drops sharply in 2022 and the rate for reduced or free rent rises sharply at the same time, while the total moves smoothly and Eurostat flags no break. We found no official explanation in ELSTAT releases. We therefore present only the latest 2025 values here and draw no trend, or change in Greece’s ranking over time, for tenants. The survey rests on a sample of 10,408 households, and the subgroups are smaller.
Income, household size, city and village
The burden does not stop at low incomes. In the middle fifth of the population 12.8% are burdened (EU 3.1%) and in the second poorest fifth 31.8% (EU 6.9%). For one-adult households the rate is 63.9%, in the EU 19.9%.
Two shifts show since 2021. Until 2022 households with dependent children had a higher burden than those without (27.6% against 26.0% in 2022). In 2025 it is 22.4% against 29.8%. And the gap between city and countryside disappeared: in 2021 cities had 32.4% and rural areas 22.0%, in 2025 26.9% and 26.4%.
Rents: higher, but not back to 2010 levels
The consumer price index for rents paid by tenants stood in 2025 at 113.3 (2015 = 100), 8.0% below the 123.1 of 2010. It had fallen to 92.2 in 2018 and stayed there until 2020. In the EU the index rises steadily, from 93.2 to 120.5. The annual rate in Greece reached 11.4% in June 2025 and eased to 5.9% in September 2026 (EU 2.9%).
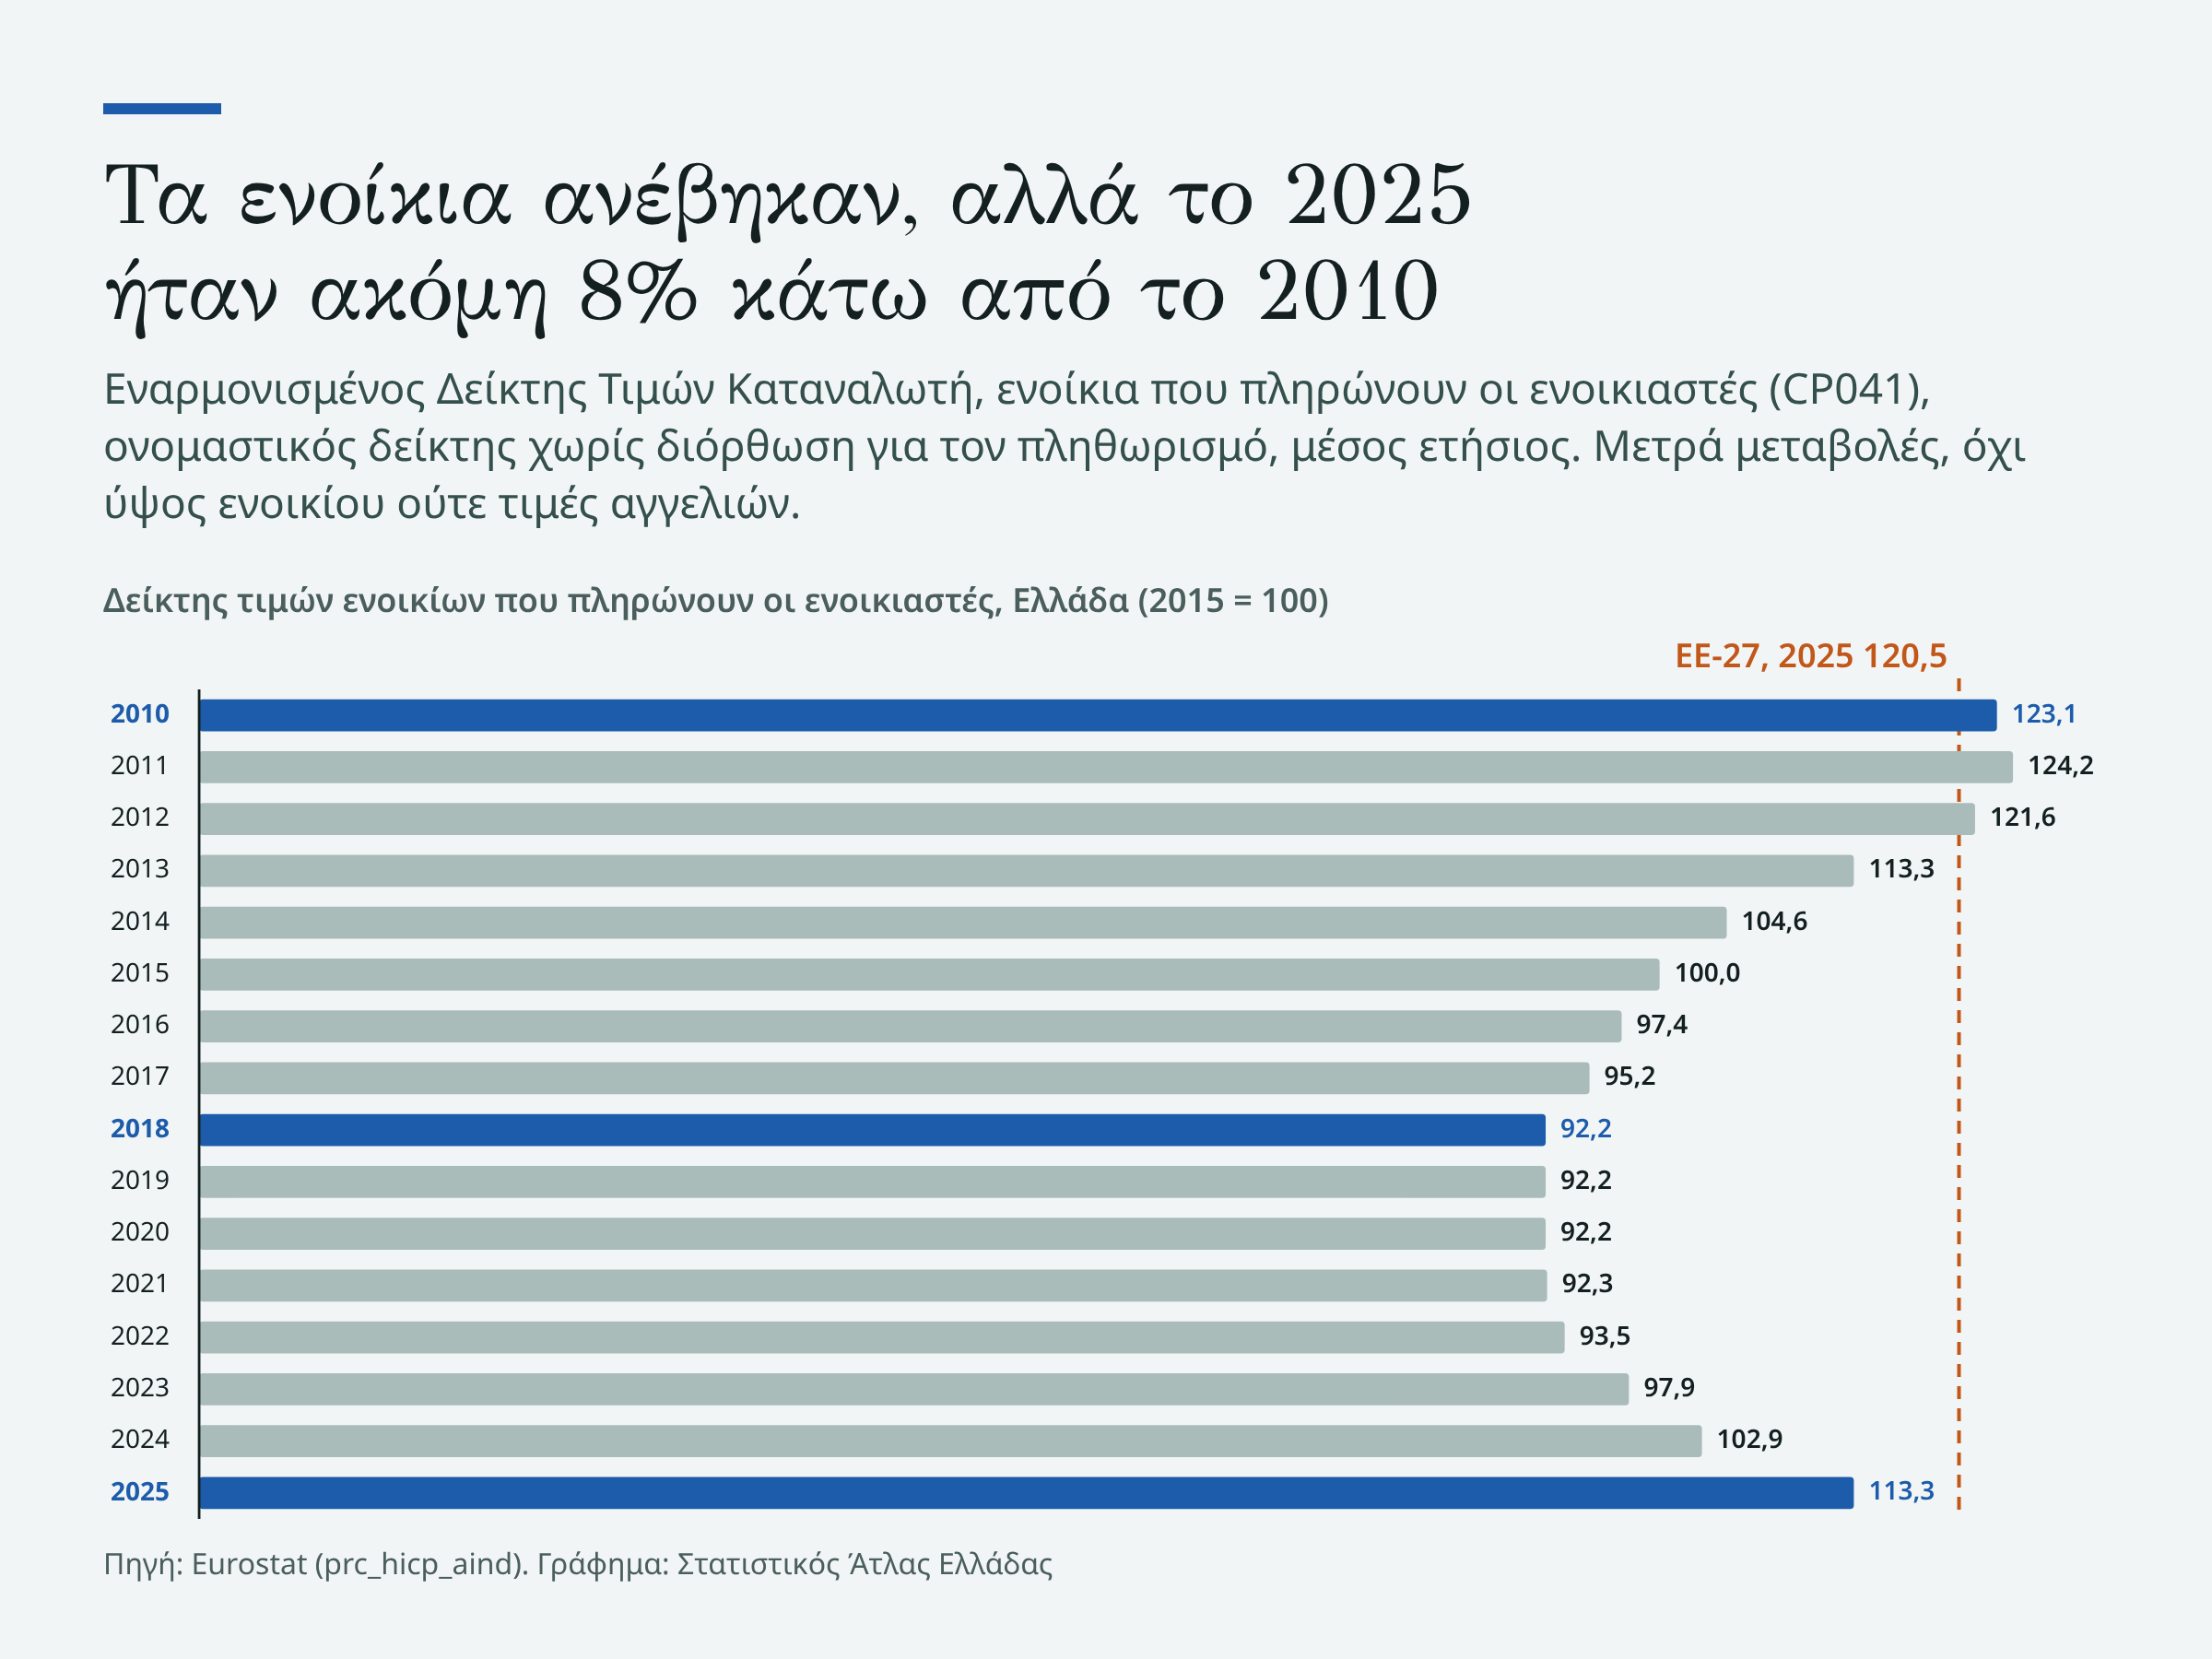
The index measures changes, not rent levels, and not listing prices. It is a nominal index, that is, it does not remove inflation, and in 2025 the average annual rate was 10.0%. It is not directly comparable with the income survey, which measures 2024 income, and we do not say one explains the other.
What the state announced
The Ministry of Social Cohesion and Family counts, in its September 2026 presentation, more than 45 interventions with a budget above 6.5 billion euros. The 2025 rent refund reached 877,267 beneficiaries, with 201.6 million euros, and the housing allowance 481,264 from January to August 2026. From 2027 the ENFIA property tax is abolished in settlements of up to 2,000 residents, for about 62,000 additional owners. The 2025 survey does not yet show what these measures did, because it measures 2024 income.
What we do not know
We do not know why the tenant series change sharply in 2022, or how 2026 rents will show up in the next survey. We do not know how many burdened owners pay mainly bills and taxes and how many a loan instalment, because the tables do not split them. The data do not say what caused the changes. They show only who is burdened in 2025 and how the total moved over the years.
How we measured it
Burden rates by tenure, income quintile, urbanisation and household type come from the Eurostat tables ilc_lvho07c, ilc_lvho07b, ilc_lvho07d and ilc_lvho07e, and the population distribution from ilc_lvho02. The composition of those with a burden is our calculation: the tenure group’s population share times its burden rate, divided by the sum. The sum matches the official total within 0.1 point. The EU is the EU-27. Eurostat flags EU values up to 2018 as estimates (e) and Denmark 2025 as a break. The Greek series carries no flag, despite the sharp change for tenants in 2022. The rent index is nominal. The rent index is category CP041 of prc_hicp_aind, and the monthly rate comes from prc_hicp_minr. The ELSTAT survey covers private households only.
Sources
Eurostat, tables ilc_lvho07b, ilc_lvho07c, ilc_lvho07d, ilc_lvho07e, ilc_lvho02, prc_hicp_aind, prc_hicp_minr.
ELSTAT, Survey on Income and Living Conditions 2025, press releases of 19 March 2026.
Ministry of Social Cohesion and Family, results presentation, September 2026.

